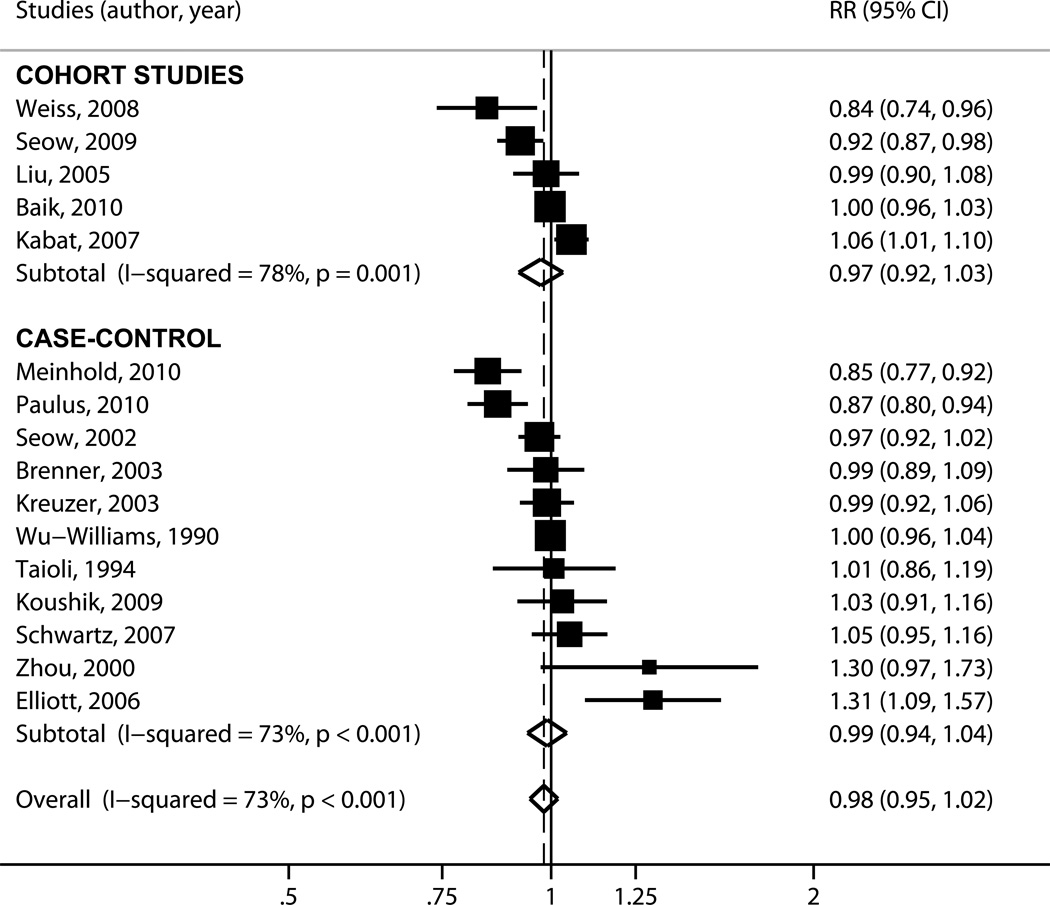
Figure 2.
Forest plot for the meta-analysis of parity and lung cancer risk. Each study is shown by the point estimate of the RR (square proportional to the weight of each study) and 95% CI for the RR (extending lines); summary RRs and 95% CIs by random effects calculations are depicted as a diamonds. Point estimate values higher than 1 indicate that increasing parity is associated with increased lung cancer risk. Results are stratified by study design (case-control versus cohort) and then studies are listed by their reported per-child relative risk. CI = confidence interval; RR = relative risk.

