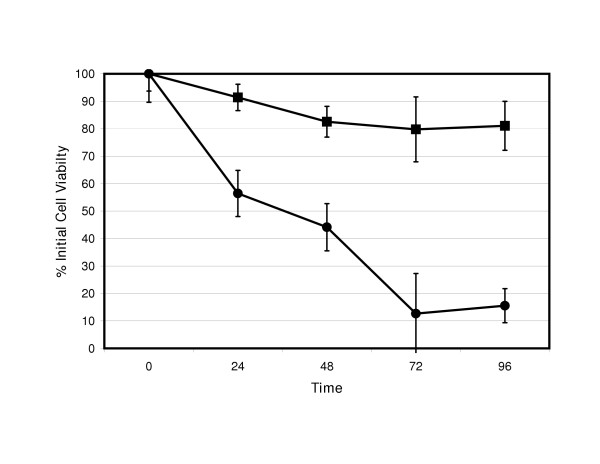
Figure 4.
RT2 Cell viability after ONYX-015 infection. Cell viability (as % viable cells; y-axis) of RT2-GFP (■) and RT2-HSP72 (●) cell lines after infection with ONYX-015 at a MOI of 300 over time (x-axis). There is statistical significance (p < 0.05) when comparing GFP and HSP72 transfected cell numbers by analysis of variance at the 72 and 96 hour time points.

