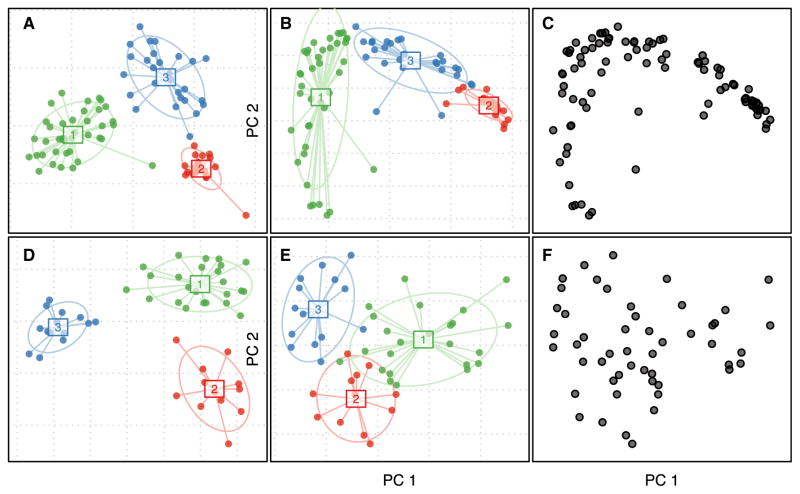
Figure 2. Common Visualizations Can Support Different Conclusions.
(A) Between-class analysis of soil samples with varying pH (Lauber et al., 2009). The ordination method used is supervised, meaning that the plot is intended to make the clusters look as separate as possible, while assuming that the clusters are valid based on simulated data.
(B) Unsupervised principal coordinates plot of soil samples in (A), colored by membership in putative, but nonsignificant, clusters.
(C) Exactly the same plot as (B) but without colors or annotation, revealing a lack of clear discrete structure in the data.
(D–F) The same types of plots as (A)–(C) but using simulated data with three dominant taxa and with no discrete cluster structure (Supplemental Information).

