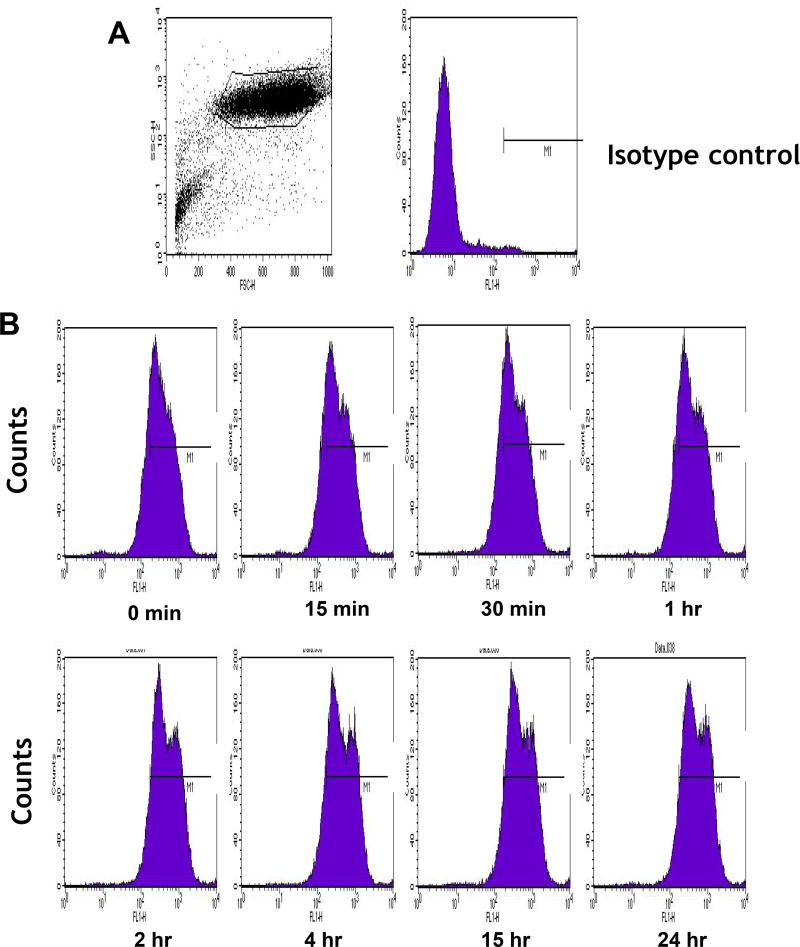
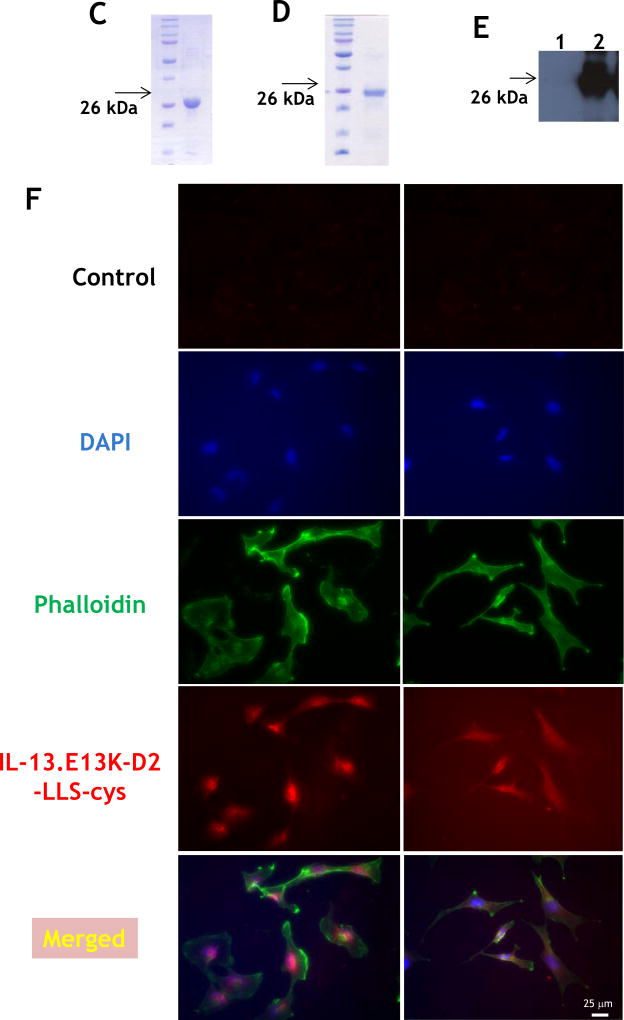
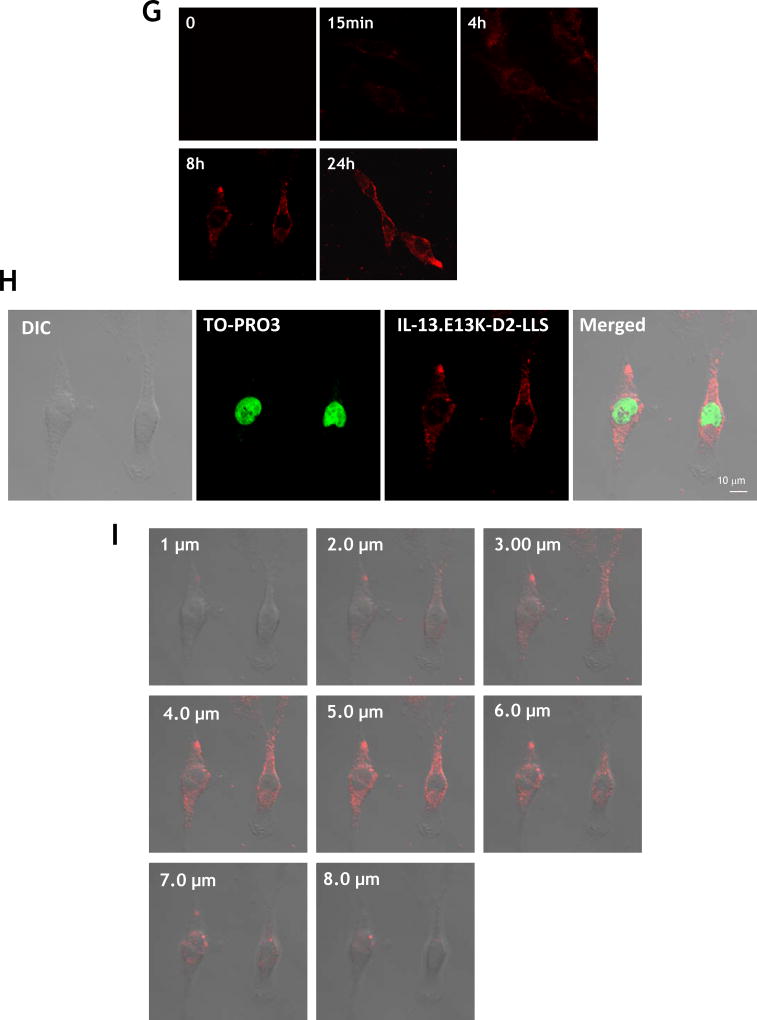
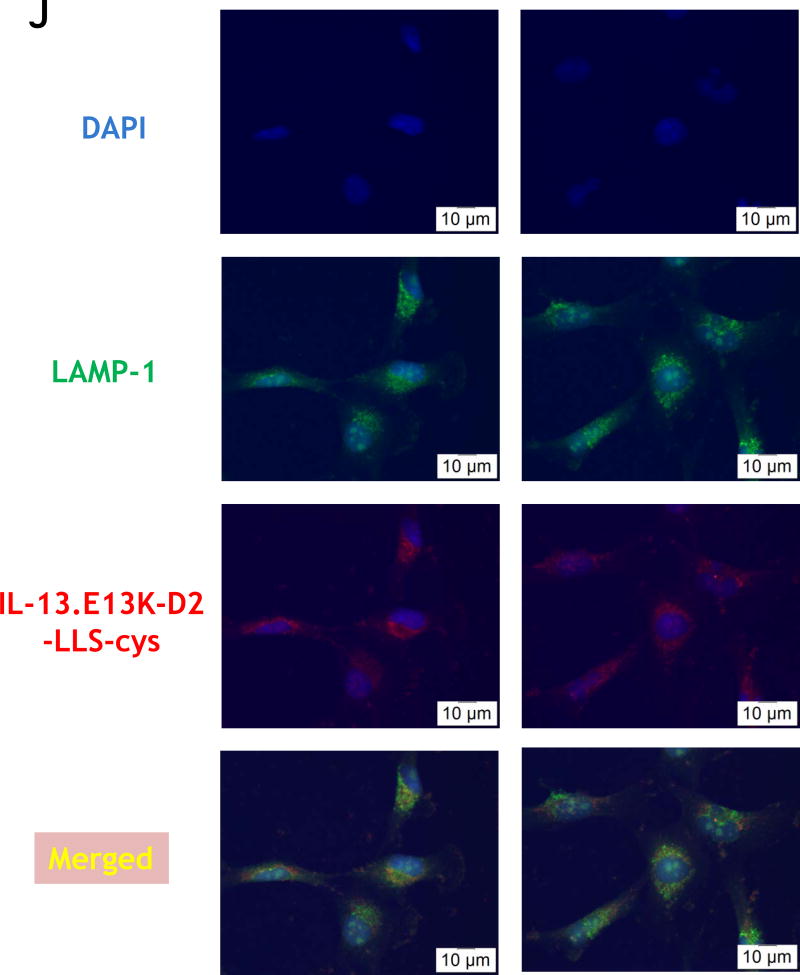
Figure 1.
(A,B) Flow cytometry for IL-13RA2 in U-251 GBM cells. Isotype control (A) and (B) receptor detection at various timepoints. Highly purified IL-13.E13K-D2-NLS-cys (C) and IL-13.E13K-D2-LLS-cys (D). (E) Immunoblot of non-biotinylated (lane 1) and biotinylated (lane 2) IL-13.E13K-D2-LLS-cys probed with streptavidin-HRP. (F,G) Internalization of biotinylated IL-13.E13K-D2-LLS-cys (1 µM) in U-251 MG cells. The cells were analyzed using anti-streptavidin Alexa Fluor 555 (red) by fluorescence microscopy. Two different fields are shown in two column panels. (H) U-251-MG cells were treated with biotin-labeled IL-13.E13K-D2-LLS-cys (1 µM) and cells were stained for the nuclei and the protein. DIC, differential interference contrast. (I) Subcellular localization of IL-13.E13K-D2-LLS-cys was monitored using Z-stack analysis. (J) Internalization and intracellular distribution of IL-13.E13K-D2-LLS-cys. U-251 MG cells were incubated for 8 hrs with 1 µM biotin-conjugated IL-13.E13K-D2-LLS-cys (red) with co-staining of LAMP-1 protein (green).


