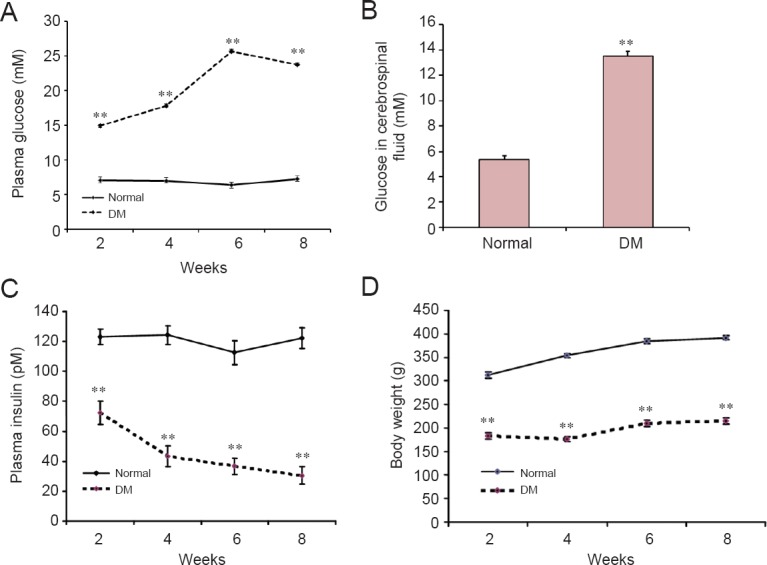
Figure 2.

Metabolic parameters from rats in 2 consecutive months after streptozotocin injection.
(A) Plasma glucose increased in the DM group compared with the normal group. (B) Glucose levels in cerebrospinal fluid increased in the DM group compared with the normal group at 8 weeks after treatment. (C) Enzyme linked immunosorbent assay showed decreased plasma insulin in the DM group compared with the normal group. (D) Body weight gain was less in the DM group compared with the normal group. DM group: Overnight-fasted rats were injected once with 65 mg/kg streptozotocin through the femoral vein to induce DM. Normal group: Age-matched normal rats received an equivalent volume of normal saline. **P < 0.01, vs. normal group (mean ± SEM, n = 13). One-way analysis of variance was performed for multiple-group comparisons, with Tukey's post-hoc analysis for unpaired group comparisons. Experiments were performed in triplicate. DM: Diabetes mellitus.
