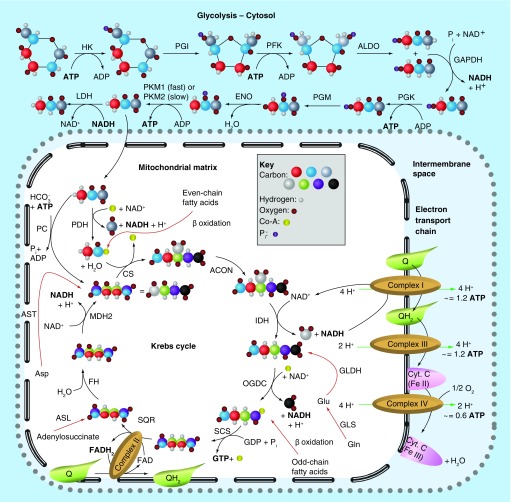
Figure 1. . Schematic overview of cellular energetics.
Three primary metabolic pathways supply cells with biosynthetic intermediates and ATP: glycolysis (top), the Krebs cycle (left) and the electron transport chain (right and bottom). Glycolysis converts glucose to pyruvate, and consumes two molecules of ATP in the process, but splits glucose into two molecules (top right), further conversions of which eventually produce two ATPs each, for a net total of two ATPs. Two NADHs are also generated, which can fuel the electron transport chain. Pyruvate then enters the mitochondria where it is used to generate acetyl-CoA for the Krebs cycle, or exits the cell as lactate (regenerating NAD+ and allowing glycolysis to continue). The Krebs cycle turns once per acetyl-CoA molecule fed in, and so turns twice per molecule of glucose. Each turn of the Krebs cycle produces four molecules of NADH, one molecule of GTP and one molecule of FADH2. NADH enters the electron transport chain at Complex 1, which reduces membrane soluble ubiquinone (Q) to ubiquinol (QH2), and exports four protons to the intermembrane space (IMS). Complex III transfers electrons from QH2 to membrane-anchored cytochrome C, reducing the bound heme and simultaneously exports a further four protons to the IMS. Finally, Complex IV uses molecular oxygen to re-oxidize cytochrome C, and exports another 2 protons to the IMS per unit of NADH. Complex II (i.e., SQR) generates FADH2 to reduce Q to QH2, but without any proton transport. Every ten protons exported can ideally generate three units of ATP via ATP synthase (not shown), for a total of 34 ATP molecules (∼3 per NADH, ∼2 per FADH2 generated during cellular metabolism) and two GTP molecules per glucose molecule, but proton leakage and the use of protons to transport pyruvate and phosphate into the matrix reduce this number to approximately 29–31 ATP/GTP molecules formed per glucose molecule. The Krebs cycle can be supplied with intermediates from five sources in addition to glucose, shown with red arrows. Carbon atoms are represented by large spheres of different colors, and are given mixed colors to represent the point at which molecules gain symmetry and unique carbons become mixed; none of the pyruvate carbon atoms used to form citrate leave as CO2 during a single turn of the Krebs cycle. Hydrogens are shown only on carbon, to assist in tracing oxidation states. Anaplerotic reactions are shown as red arrows, and proton transport is shown by green arrows.
ACON: Aconitase; ALDO: Aldolase; ASL: Adenylosuccinate lyase; AST: Aspartate transaminase; CS: Citrate Synthase; ENO: Enolase; FH: Fumarase; GAPDH: Glyceraldehyde phosphate dehydrogenase; GLDH: Glutamate dehydrogenase; GLS: Glutaminase; HK: Hexokinase; IDH: Isocitrade dehydrogenase; IMS: Intermembrane space; LDH: Lactate dehydrogenase; MDH2: Malate dehydrogenase; OGDC: α-Ketoglutarate dehydrogenase; PC: Pyruvate carboxylase; PDH: Pyruvate dehydrogenase; PFK: Phosphofructokinase; PGI: Phosphoglucose isomerase; PGK: Phosphoglycerate kinase; PGM: Phosphoglycerate mutase; PKM1/PKM2: Pyruvate Kinase M1/M2; Q: Ubiquinone; QH2: Ubiquinol; SCS: Succinyl coenzyme A synthetase; SQR: Succinate dehydrogenase.

