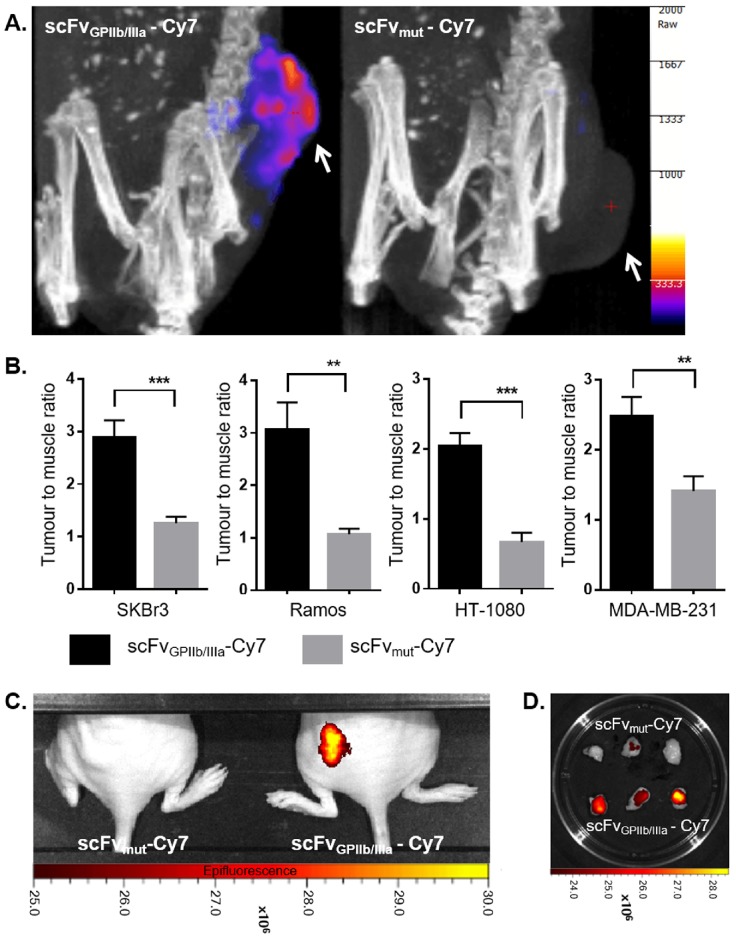
Figure 3.
Specific tumour localization of ScFvtarg-Cy7 via fluorescence imaging. FLECT imaging of SKBr3 tumour-bearing BALB/c nude mice at 20 hours post injection of scFvGPIIb/IIIa-Cy7 or scFvmut-Cy7, with areas of tumours indicated by a white arrow (A). Quantification of mean fluorescence intensity of mice injected with scFvGPIIb/IIIa-Cy7 and scFvmut-Cy7 was presented as tumour to muscle ratio for SKBr3 xenografts; (n=11) and (n=9), Ramos Xenografts; (n=7) and (n=6), HT-1080 Xenografts; (n=6) and (n=6) and MDA-MB-231 xenografts; (n=7) and (n=7) (B). Mice were also imaged with a 2D IVIS scanner 20 hours following injection of tracer (C). Ramos tumour sections of mice injected with scFvGPIIb/IIIa-Cy7 or ScFvmut-Cy7 were excised and imaged with IVIS (D). Statistical analysis was performed using unpaired Student's T test and statistical significance was assigned for p values <0.01 and <0.001, and represented by ** and ***, respectively.

