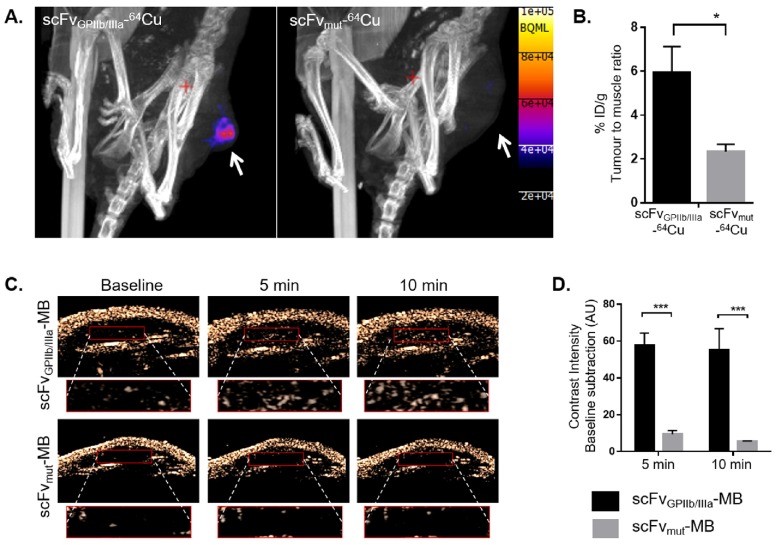
Figure 4.
Specific localization of scFvGPIIb/IIIa in SKBr3 xenograft via PET/CT and ultrasound imaging. Nano PET/CT imaging of SKBr3 tumour bearing BALB/c nude mice at 2 hour post injection of scFvGPIIb/IIIa-64Cu (n=7) or scFvmut-64Cu (n=5) (A) with areas of tumours indicated by a white arrow. Quantification of radiation intensity was presented as percentage injected dose/gram (% ID/g) of tumour normalised to muscle signals (B). Ultrasound imaging of SKBr3 tumour bearing BALB/c nude mice at baseline, 5 and 10 min post injection of scFvGPIIb/IIIa-MB (n=4) or scFvmut-MB (n=3). The bottom panel of each image indicates a zoomed-in magnification of the tumour (red box) and the contrast intensity visualization within this tumour region (C). Quantification was presented as contrast intensity baseline subtraction (AU) (D). Statistical analysis was performed using unpaired Student's T test and statistical significance was assigned for p values <0.05 and <0.001, and represented by * and ***, respectively.

