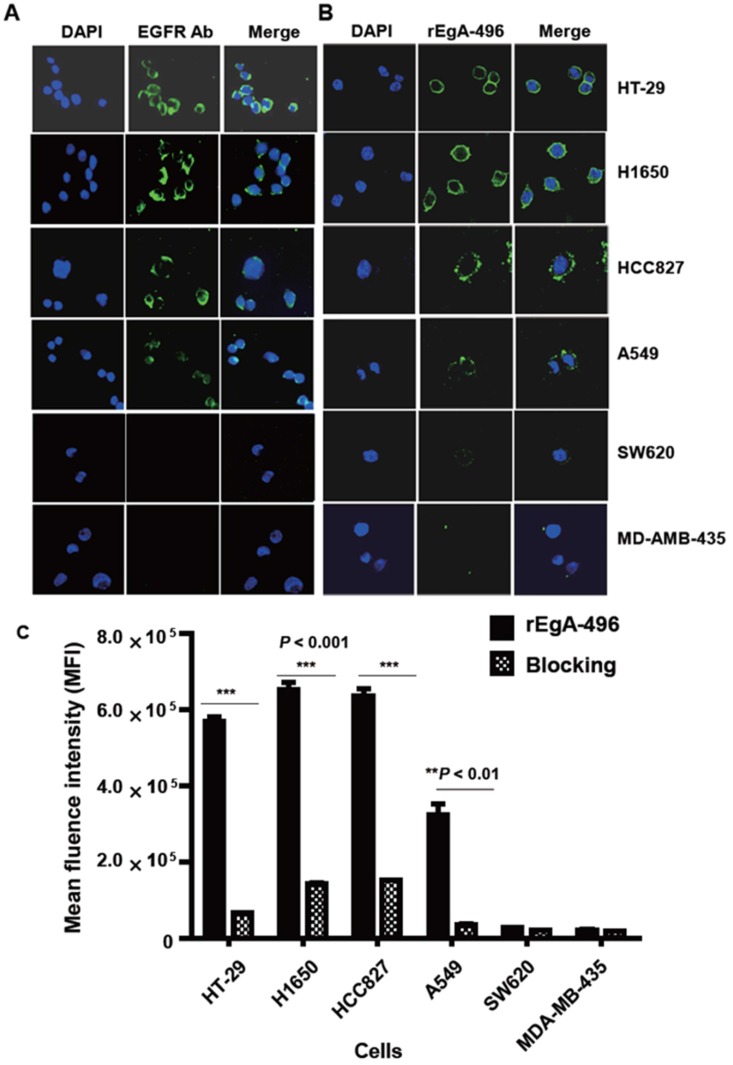
Figure 4.
Binding of rEgA-496 to various tumor cells. Binding of (A) EGFR antibody (left) and (B) rEgA-496 (right, 0.1 μM, green color) to the indicated tumor cells, as determined by confocal microscopy (400×) after immunofluorescence staining. The nuclei are counterstained with DAPI (blue). (C) Binding of rEgA-496 (0.1 μM) to the indicated tumor cells measured by flow cytometry analysis. Cells were incubated with rEgA-496 (■). Cells were pre-treated with 10 μM naive rEgA, and then subsequently treated with 0.1 μM rEgA-496 (▩).

