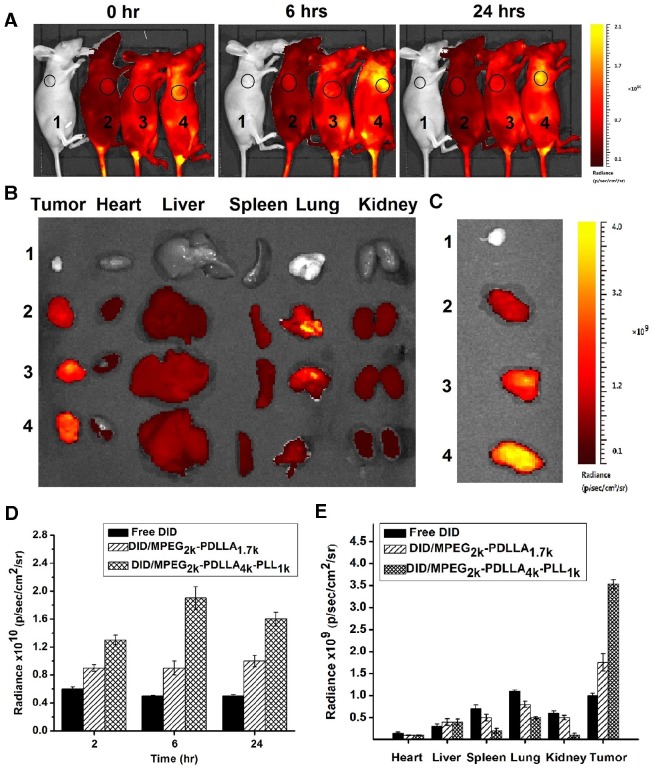
Figure 10.
In vivo biodistribution of control 1, free DID 2, DID/MPEG2k-PDLLA1.7k 3 and DID/MPEG2k-PDLLA4k-PLL1k 4. Real-time fluorescence images of the tumor-bearing mice after intravenous injection at set time points (A); the fluorescence images of ex vivo mean organs and tumors at 24 hrs post-injection (B); the fluorescence images of tumors (C); the quantitative analysis of fluorescence intensity in tumors at set time points post-injection (D); the quantitative analysis of fluorescence intensity in ex vivo mean organs and tumors (E)

