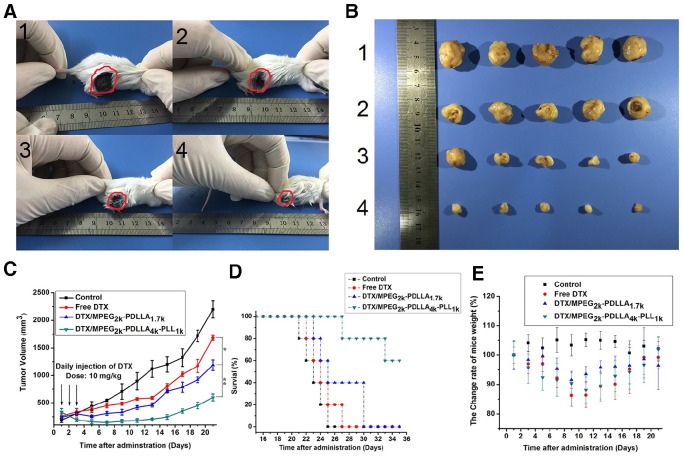
Figure 12.
The micelles inhibited tumors growth in MCF-7 model, control 1, free DTX 2, DTX/MPEG2k-PDLLA1.7k 3 and DTX/MPEG2k-PDLLA4k-PLL1k 4. Images of MCF-7 tumor bearing mice with different treatments on 21 days after administration (A); images of subcutaneous tumors in each group (B); growth curves of tumor in the mice (C); Survival of the 4T1 tumor-bearing mice (D); body weight of the mice in each group (E). Statistical difference between groups (“*” p˂0.05) (“**” p˂0.01)

