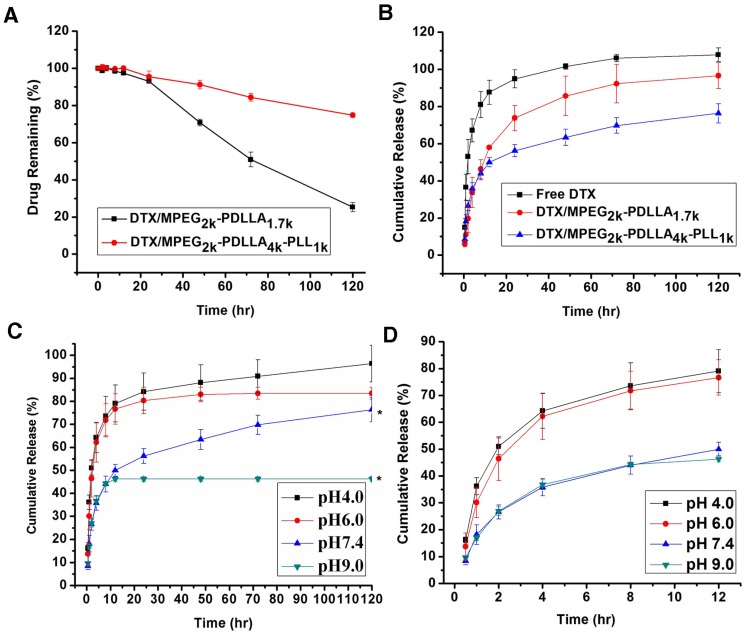
Figure 7.
The release profile of DTX formulations. The content of DTX remaining in the micelles aqueous solution (A); the DTX formulations release profiles in PBS 7.4 (B); In vitro release profiles of DTX from DTX/MPEG2k-PDLLA4k-PLL1k system in different pH media (C); the first 12 hrs of the in vitro release profiles in different pH media (D). Statistical difference from the free DTX group (“*” p˂0.05)

