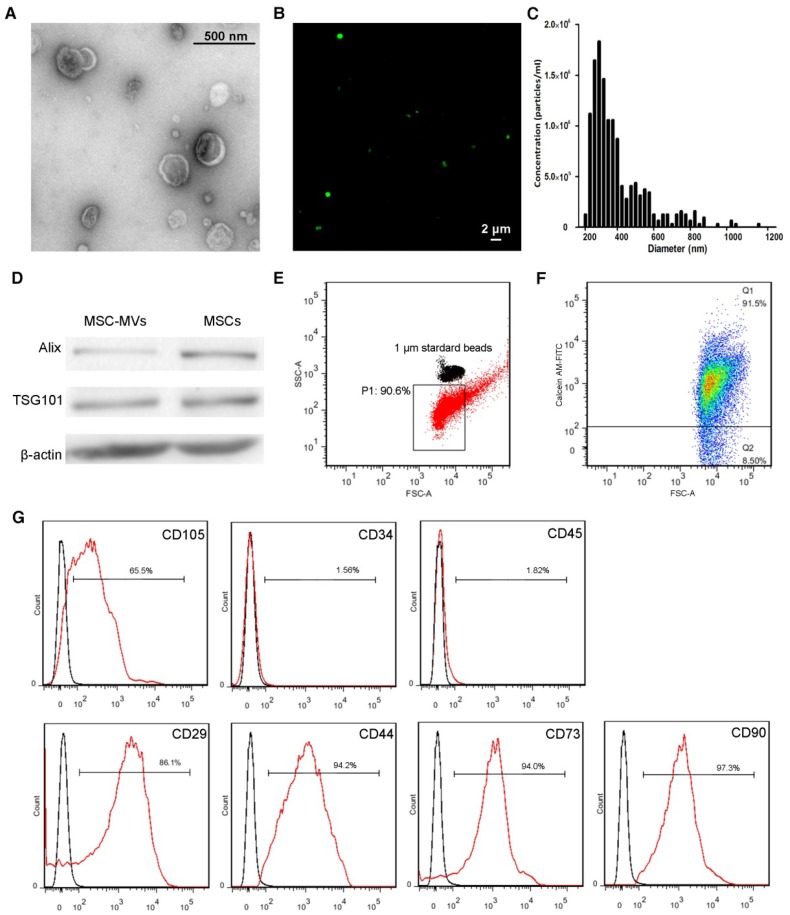
Figure 2.
Characterization and validation of MSC-MVs. (A) Representative micrograph of MSC-MVs observed by transmission electron microscopy (TEM). Scale bar, 0.5 μm. (B) CFSE-labelled MSC-MVs observed by confocal microscopy. Scale bar, 2 μm. (C) TRPS analysis of the size distribution of MSC-MV samples. (D) Western blot analysis of proteins isolated from MSC-MVs or MSCs. (E) Representative flow cytometry plots of MSC-MV samples using 1 μm standard beads. (F) Integrity of MSC-MVs samples detected by FCM. (G) FCM analysis of the surface markers of MSC-MVs.

