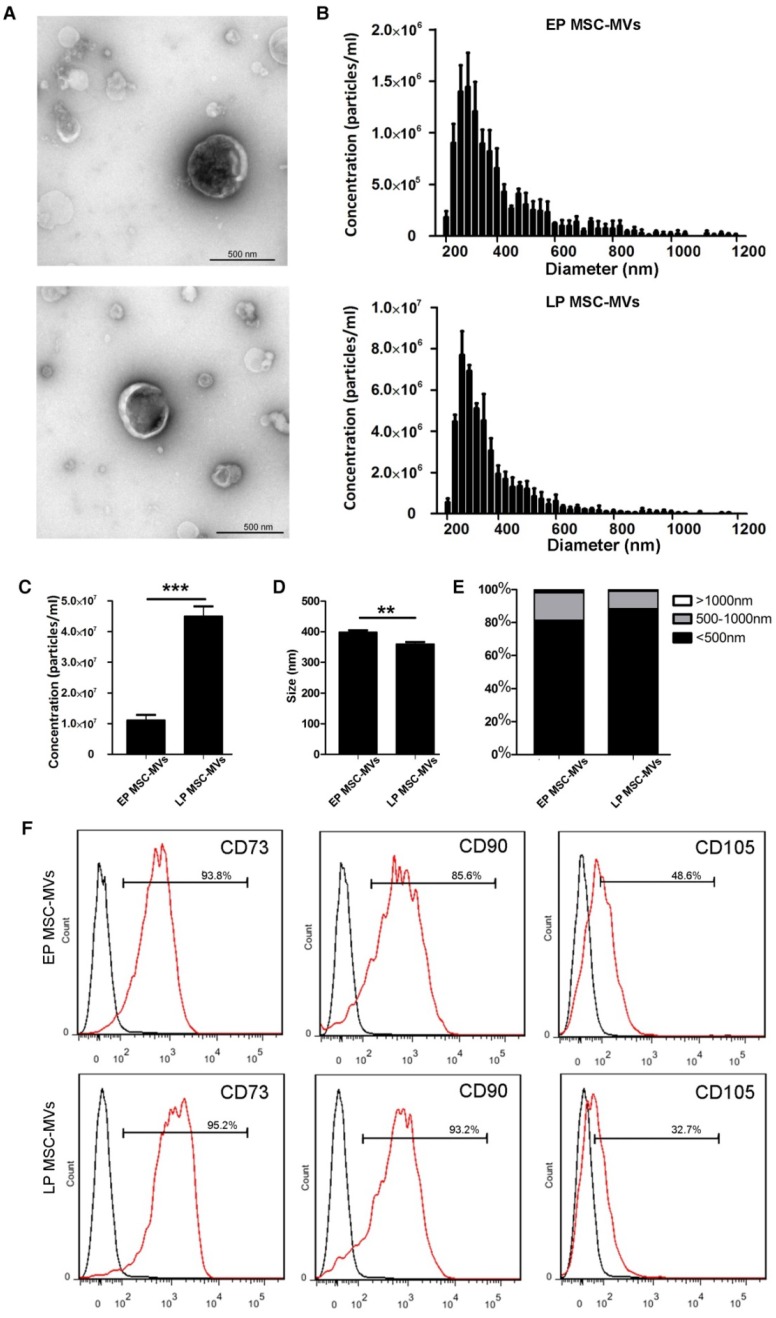
Figure 3.
Differences in concentration, size, and immunophenotype between MSC-MVs derived from EP and LP MSCs. (A) TEM images of EP and LP MSC-MVs. Scale bar, 500nm. n = 3. (B) Size distribution of EP and LP MSC-MVs. n = 3. (C) Concentration of EP and LP MSC-MVs. n = 3. (D) Average size of EP and LP MSC-MVs. n = 3. (E) Size composition of EP and LP MSC-MVs. (F) FCM analysis of the expression of surface markers on EP and LP MSC-MVs. Each experiment was confirmed in five different donors and the representative data are shown. Abbreviations: EP: early passage; LP: late passage.

