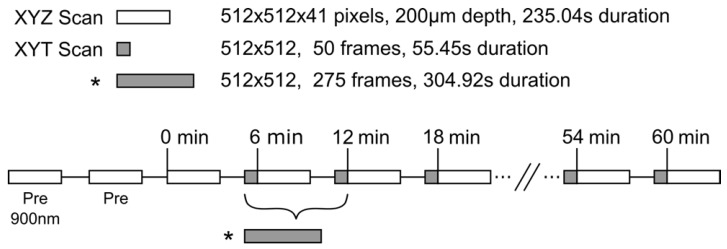
Figure 2.
Experimental timing diagram describing the 2PM imaging paradigm used to image the release of DOX from LTSL-DOX during FUS+HT to 42°C. The asterisk (*) indicates a longer time series which replaces the first two time series and the first depth scan in the standard imaging paradigm, this is to image the release of DOX during the entire sonication in the 3.5min of FUS+HT group. The LTSL-DOX is administered in a 5min infusion starting at time 0 in all groups except the 20min FUS+HT group, in which case the tumor tissue is heated to 42°C in the first 6min at which point the LTSL-DOX in infused. All imaging scans were performed with an excitation wavelength of 810nm unless indicated otherwise.

