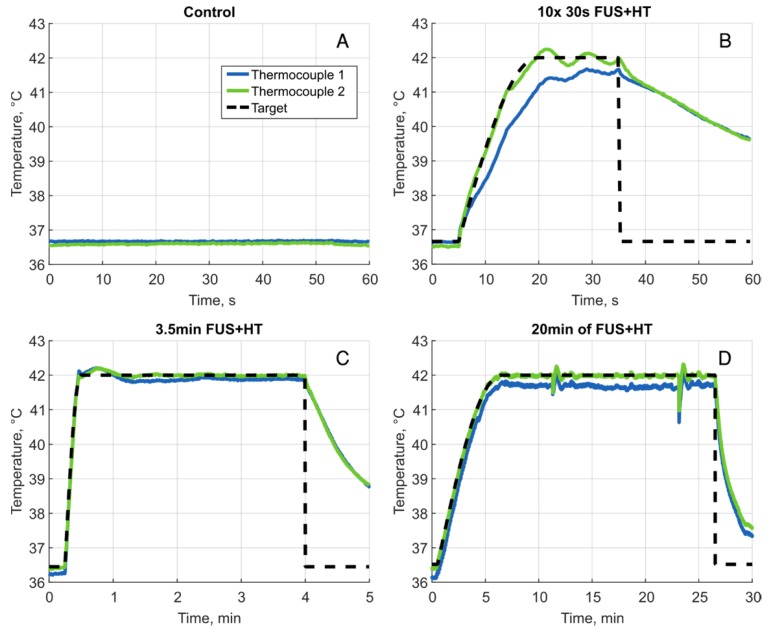
Figure 3.
Sample heating curves for all 4 heating groups. A, Unheated control, B, one example of a 30s FUS+HT burst to 42°C, there were 10 bursts in total for each mouse in this group separated by 5 minutes. C, A heating curve during 3.5min of FUS+HT and D 20min of FUS+HT with a 6 minute exponential ramp to the target temperature. The large perturbations of the temperature response in this case occurred as a result of adding water to the coverslip glass in order to maintain water coupling to the objective lens, this sudden cooling of the tumor tissue was promptly corrected for by the controller.

