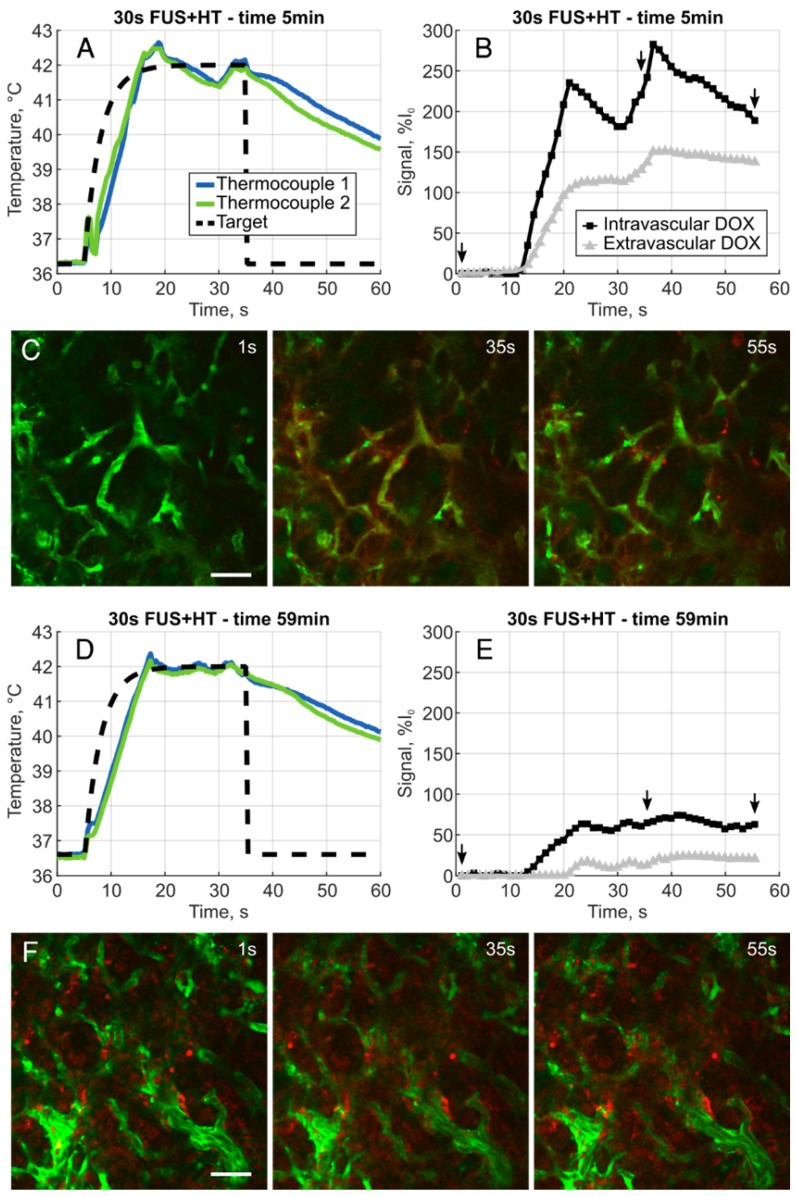
Figure 4.
A, Example heating curve during the first 30s burst of FUS+HT at the 5 minute time point immediately following the infusion of drug. B, Clear evidence of the release of DOX is seen from the measured intra- and extravascular signal changes and images representing this acquisition, denoted by the small arrows, are shown in C. D, Example heating curve during the tenth and final 30s burst of FUS+HT at the 59 minute time point. E, There are still measureable amounts of DOX being released, but the amplitude of the signal change has diminished as seen in F due to the reduction in circulating LTSL-DOX. In all 2PM images green is the FITC-labelled vasculature, DOX is red, scale bar = 50µm.

