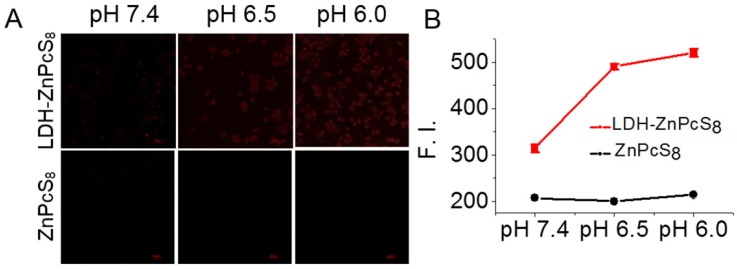
Figure 4.
pH-responsive fluorescence emission of LDH-ZnPcS8 at the cellular level: (A) Confocal fluorescence images of HepG2 cells after incubation with LDH-ZnPcS8 and ZnPcS8 at 0.1 μM for 30 min, followed with 25 μM nigericin solutions at pH 7.4, 6.5 and 6.0 for 20 min. Scale bars= 50 μm. (B) Comparison of the relative intracellular fluorescence intensities. Data are expressed as mean values ± standard deviation (number of cells = 50).

