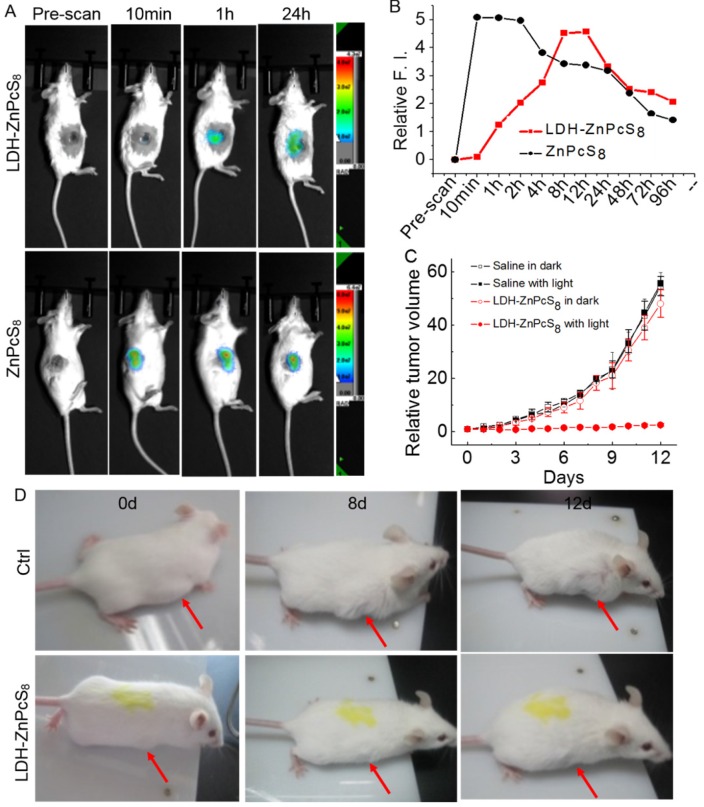
Figure 6.
In vivo activation of LDH-ZnPcS8: (A) In vivo fluorescence imaging of mice and (B) relative fluorescence intensities after intratumoral injection with LDH-ZnPcS8 and ZnPcS8 at different time points. (C) The tumor growth curves of the four groups of mice after treatment (Drug dose: ~0.9 μmol•Kg-1. Light condition: wavelength, 685 ± 4 nm; power density, 140 mW•cm-2 ; irradiation, 30 min. Drug light interval: 5 h.). The error bar is based on standard deviation of mice per group. (D) Representative photos of mice bearing tumors after treatment. (top: saline with light. bottom: LDH-ZnPcS8 with light.) The arrows indicate tumor sites.

