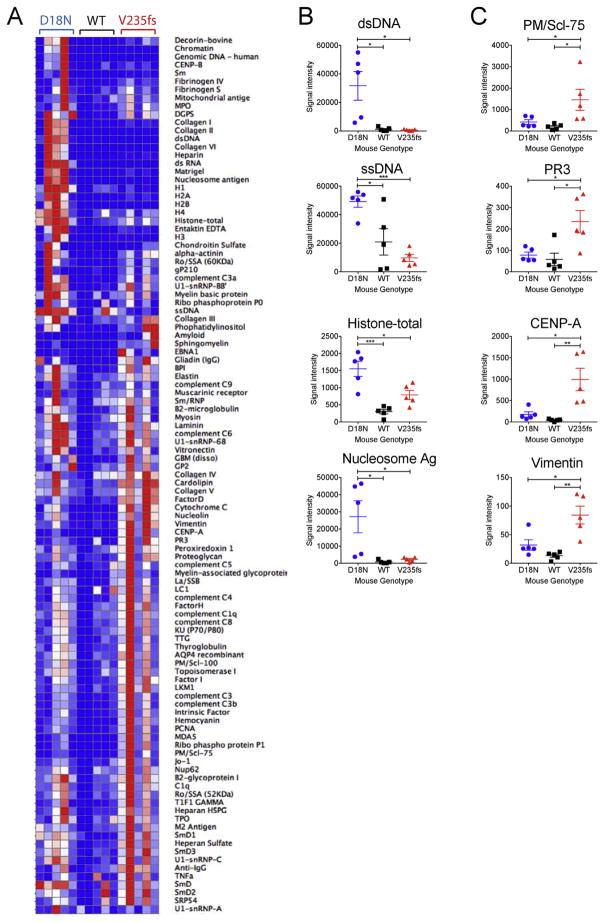
Fig. 6.
D18N and V235fs mice exhibit distinct profiles of autoantibodies. (A) A heatmap of IgG autoantibody array. Mouse sera (n = 5, 6–8 month old) were analyzed by autoantibody array. Mouse genotypes are indicated on top. (B) Representative DNA-related autoantibody measurement from A. (C) Representative non-DNA-related autoantibody measurement from A. Statistical analysis was performed using t-test comparing V235fs vs D18N or V235fs vs WT. *, p < 0.05. **, p < 0.01. ***, p < 0.001. Error bar, SEM. Data are representative of at least two independent experiments.

