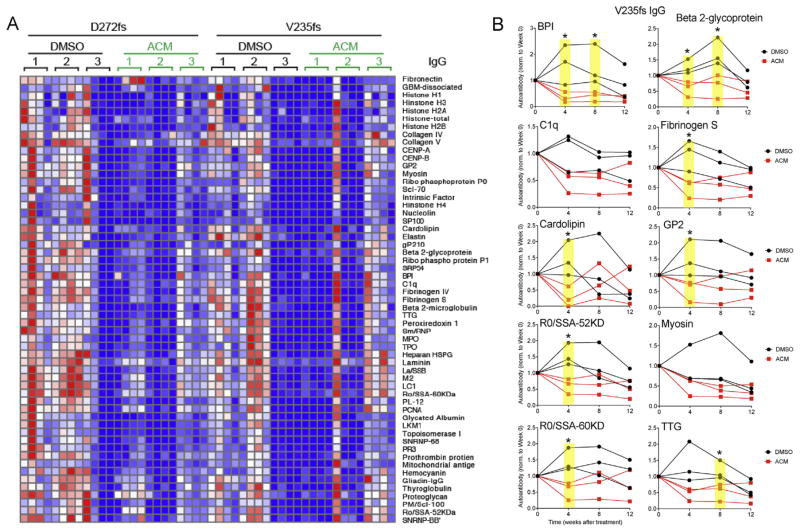
Fig. 7.
Aclacinomyin treatment suppresses autoantibody production in V235fs and D272fs mice. (A) A heatmap of IgG autoantibody array. Mouse genotypes and treatment are indicated on top. Numbers indicate individual mouse (n = 3). Each mouse was analyzed at 0, 4, 8 and 12 wks after treatment (4 columns from left to right). (B) Ten representative IgG autoantibodies measured from A. Each line represents one mouse. Autoantibody values are normalized to week 0 value for each mouse to show fold-changes after treatment. Statistical analysis was performed using t-test comparing DMSO vs ACM for each time point. *, p < 0.05 (highlighted in yellow). Data are representative of at least two independent experiments.

