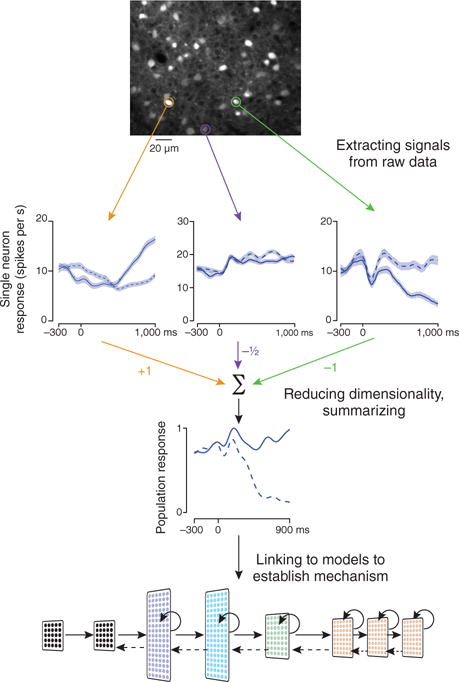
Figure 1.

Multiple stages of analysis needed for neural data to Inform our understanding of neural mechanism. Top, extracting raw signals from data. Image shows neurons in mouse parietal cortex measured using a two-photon microscope (courtesy of F. Najafi). Regions of interest corresponding to single neurons are circled. Arrows point to schematized firing rates from the neurons, grouped by behavioral condition. Middle, dimensionality reduction is used to summarize responses of a large population. In the example, a weight is assigned to each neuron, and contributions are summed to extract a population response that correlates with behavioral conditions of interest. Bottom, models then link this reduced dimensionality representation of the data to mechanism. Adapted from ref. 4.
