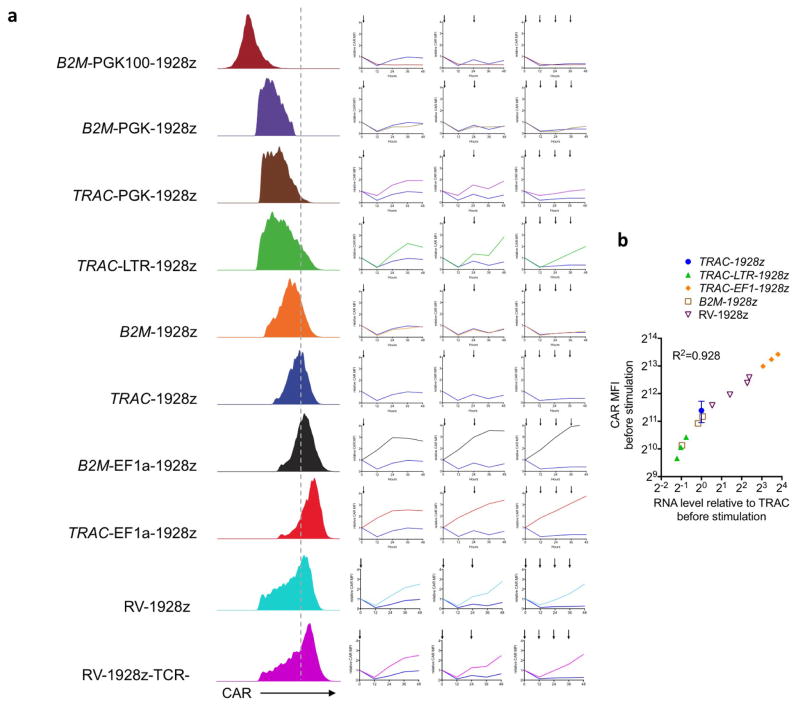
Extended Data Figure 10. Locus-promoter configuration controls CAR protein expression and transcriptional response upon CAR T cell activation.
a, Left, representative histogram of the CAR expression 5 days after its vectorization into T cells. Right, relative CAR MFI (1 =MFI at 0 h) after CAR T cells being activated 1, 2 or 4 times on CD19+ target cells over a 48 h period. b, Comparison between CAR MFI and CAR RNA relative level before stimulation (n = 3 independent experiment on 3 donors).

