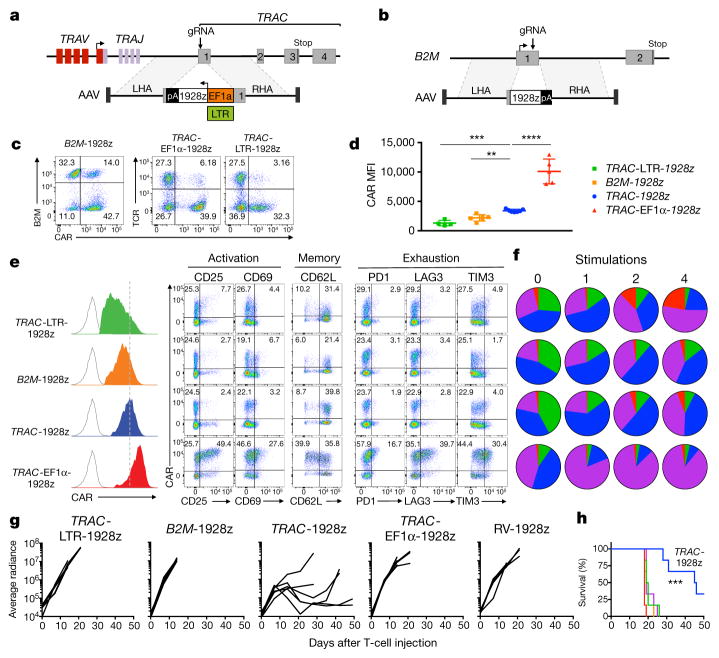
Figure 3. The endogenous TRAC promoter surpasses other locus/promoter combinations in vivo.
a, CRISPR/Cas9-targeted promoter-CAR integration into the TRAC locus. Top, TRAC locus; bottom, rAAV6 containing the promoter-CAR-polyA cassette flanked by homology arms. b, CRISPR/Cas9-targeted promoter-less CAR integration into the B2M locus. Top, B2M locus; bottom, rAAV6 containing a promoter-less CAR cassette flanked by homology arms. c, Representative B2M/CAR or TCR/CAR flow plots 4 days after gene transfer. d, CAR MFI at day 4 (n = 4–7 independent experiments; 4 donors). e, Left, CAR expression (representative histogram) at day 4. Right, FACS analysis of activation, memory, and exhaustion markers of CAR T cells at day 5 (representative of 3 donors). f, CAR T cells stimulated on CD19+ target cells 0, 1, 2 or 4 times. Pie charts show the CD62L/CD45RA phenotypes of CAR+ T cells (n = 3–5 independent experiments on different donors, colours as in Fig. 2d). g, Tumour burden (average radiance) of NALM-6-bearing mice treated with 1 × 10⁵ CAR T cells (n =6; line =one mouse).
h, Kaplan–Meier analysis of the mice survival, **P <0.01, ***P <0.001, ****P < 0.0001 (Welch’s two samples t-test (d); log-rank Mantel–Cox test (g) and Mann–Whitney test (h–k). All data are means ± s.d. See also Extended Data Figs 8, 9.

