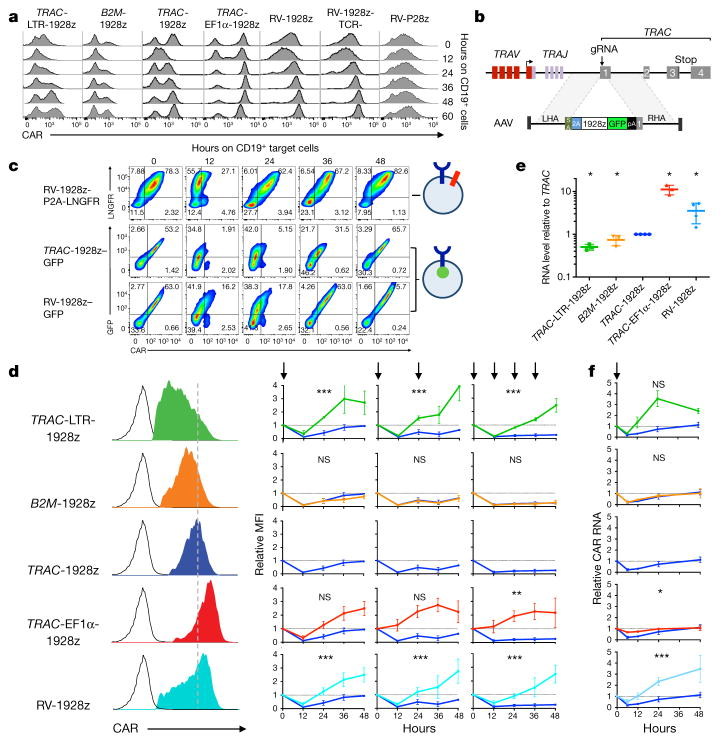
Figure 4. TRAC locus affords optimal regulation of cell-surface CAR expression.
a, Representative histogram of CAR expression before and after co-culture with CD19+ target cells. b, CRISPR/Cas9-targeted integration of a CAR-GFP fusion gene into TRAC locus. c, Upper, LNGFR/CAR expression of the bicistronic CAR-P2A-LNGFR CAR T cells before and after co-culture with CD19+ target cells. Lower, GFP/CAR expression of CAR–GFP fusion targeted into the TRAC locus or randomly integrated with the RV vector (representative of 3 independent experiments on 3 donors). d, Left, representative histogram of the CAR expression 5 days after gene transfer. Right, relative CAR MFI (1 = MFI at 0 h) of CAR T cells after 1, 2 or 4 stimulations (indicated by arrows; n =3–7 independent experiments on different donors). e, Relative CAR RNA levels (1 =TRAC RNA level) 5 days after gene transfer. f, Time-course analysis of CAR RNA levels (1 = RNA level at 0 h) in CAR T cells stimulated once on CD19+ target cells (n = 3 independent experiments on 3 donors; CAR T cells as in d). All data are means ±s.d. *P <0.05, **P <0.01, ***P <0.001 (ANOVA F-test with Bonferroni correction (d; see Supplementary Information), and Mann–Whitney test (e)). See also Extended Data Fig. 10.

