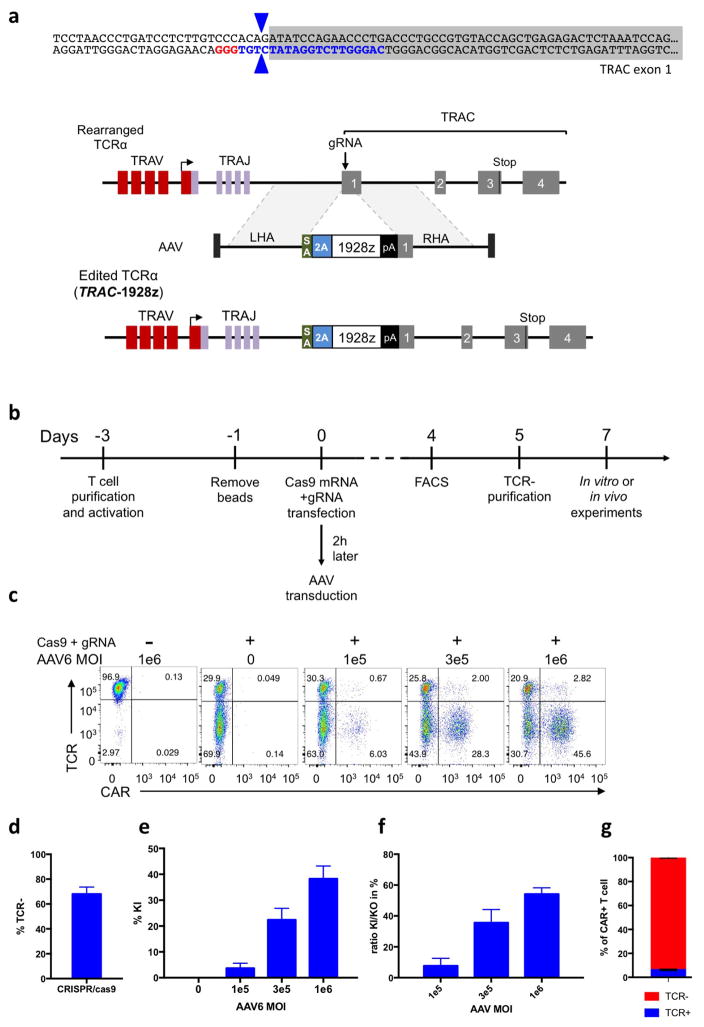
Extended Data Figure 1. CRISPR/Cas9-mediated CAR gene targeting into the TRAC locus.
a, Top, TRAC locus with the 5′ end (grey) of the TRAC first exon, the TRAC gRNA (blue) and the corresponding PAM sequence (red). The two blue arrows indicate the predicted Cas9 double strand break. Bottom, CRISPR/Cas9-targeted integration into the TRAC locus. The targeting construct (AAV) contains a splice acceptor (SA), followed by a P2A coding sequence, the 1928z CAR gene and a polyA sequence, flanked by sequences homologous to the TRAC locus (LHA and RHA, left and right homology arm). Once integrated, the endogenous TCRα promoter drives CAR expression, while the TRAC locus is disrupted. TRAV, TCRα variable region; TRAJ, TCRα joining region; 2A, the self-cleaving Porcine teschovirus 2A sequence. pA: bovine growth hormone polyA sequence. b, Timeline of the CAR targeting into primary T cells. c, Representative TCR/CAR flow plots 4 days after transfection of T cells with Cas9 mRNA and TRAC gRNA and addition of AAV6 at the indicated multiplicity of infection. d, Percentage of TCR disruption 4 days post transfection of the Cas9 mRNA and the TRAC gRNA measured by FACS analysis of the TCR expression (n =5). e, Percentage of knock-in depending on the AAV6 multiplicity of infection measured by FACS analysis of the CAR expression (n =4). f, Percentage of CAR+ cells in the TCR-negative population (n =4). g, Percentage of TCR-positive and TCR-negative in the CAR+ population analysed by FACS (n =4).

