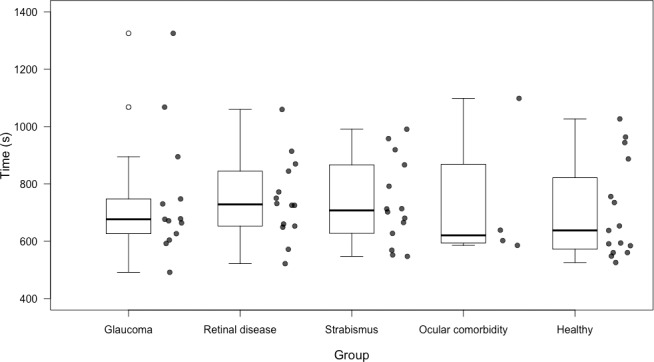
Figure 4.

Box plots showing total examination time for each group. The horizontal lines within each box represent the median for each group; the ends of the boxes are the upper and lower quartiles, and the whiskers represent minimum and maximum values. The data for each individual participant is included as peripheral scatter plots.
