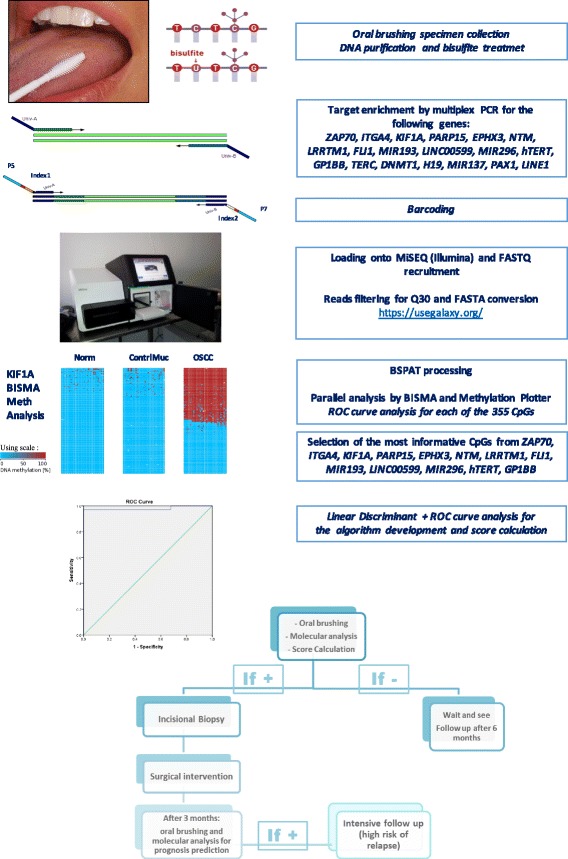
Fig. 1.

Assay flow chart: the assay design is based on various steps including minimal invasive collection of specimens by simple oral brushing in the suspected area. DNA purification and bisulfite treatment (unmethylated cytosines are chemically converted to uracyls, while methylated cytosines remained unchanged). Target-specific amplification of a set of 18 genes and LINE1 with primers of choice. Barcoding using Nextera™ index kit (Illumina), pooling and loading onto MiSEQ. Quality control of FASTQ files and filtering for > Q30 and > 80 bp in length. FASTQ to FASTA conversion and loading onto BSPAT for mapping and methylation level evaluation; parallel evaluation using perl followed by BISMA and Methylation plotter. ROC curve analysis of each of the 355 CpGs. Identification of the most informative CpGs from the following genes: ZAP70, ITGA4, KIF1A, PARP15, EPHX3, NTM, LRRTM1, FLI1, MIR193, LINC00599, MIR296, TERT, and GP1BB. An algorithm of choice was then created taking into account all of the most informative CpGs from a panel of 13 genes, using linear discriminant analysis followed by a ROC curve to calculate the exact threshold able to discriminate OSCC from normal samples. In case of a positive score, the patient follows conventional treatment with incisional biopsy and surgical intervention. After 3 months, we propose evaluating the area around the surgical intervention to identify any field cancerization and an associated high risk of recurrence
