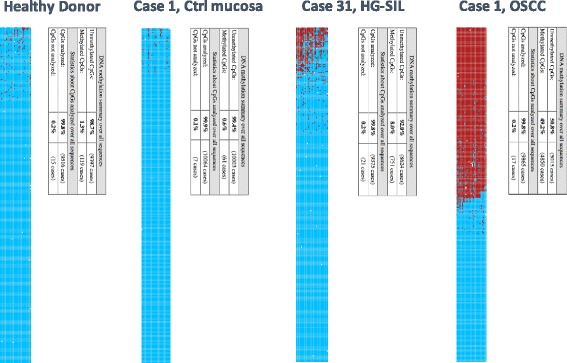
Fig. 2.

Graphic representation of methylation analysis for KIF1A among a normal healthy donor, contralateral mucosa and OSCC from case 1, and HGSIL case 31. Unmethylated CpGs are in blue, while methylated CpGs are in red. A single table for each specimen summarized the whole methylation frequency for the 27 CpGs tested
