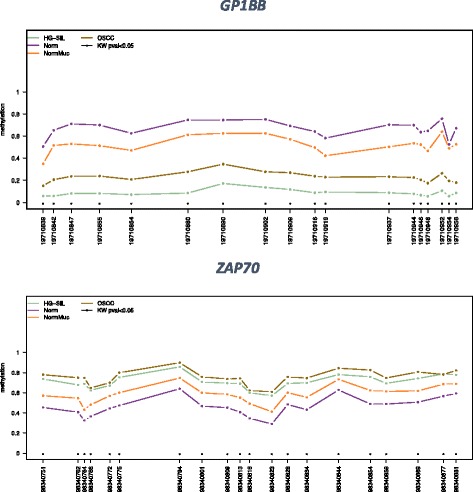
Fig. 4.

Methylation profile plot from GP1BB and ZAP70. For each group of samples, each line represents the methylation mean for each position. Asterisks indicate a statistical significance as calculated by the Kruskal-Wallis test. ZAP70 and GP1BB, together with H19, EPHX3, and MIR193 (see Additional file 1 for the methylation profile of all targets), revealed a fluctuating behavior among the various CpGs evaluated. The gap between normal and OSCC remained mostly the same (Kruskal-Wallis P values were < 0.05), but the absolute values changed conspicuously among different positions investigated
