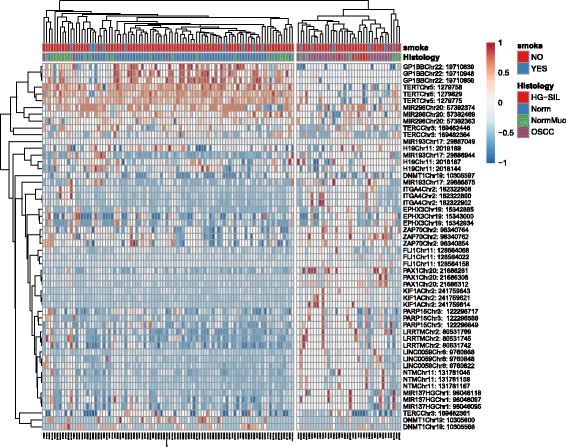
Fig. 8.

Heatmap from the best three CpG methylation data points (54 rows) for each gene and 130 samples (column). Annotation labels refer to histology and smoking status. Rows are centered; unit variance scaling is applied to rows. Both rows and columns are clustered using correlation distance and average linkage. Smoking status and histology are highlighted in color. Two clusters are marked: left cluster: 65 normal donors, 24 contralateral mucosa, two OSCC, and the OSCC with sarcomatoid features; right cluster: 26 OSCC, six HGSIL, and six contralateral mucosa. Complete heatmap from each of the 325 CpGs is available in Additional file 4
