
Fig. 7.
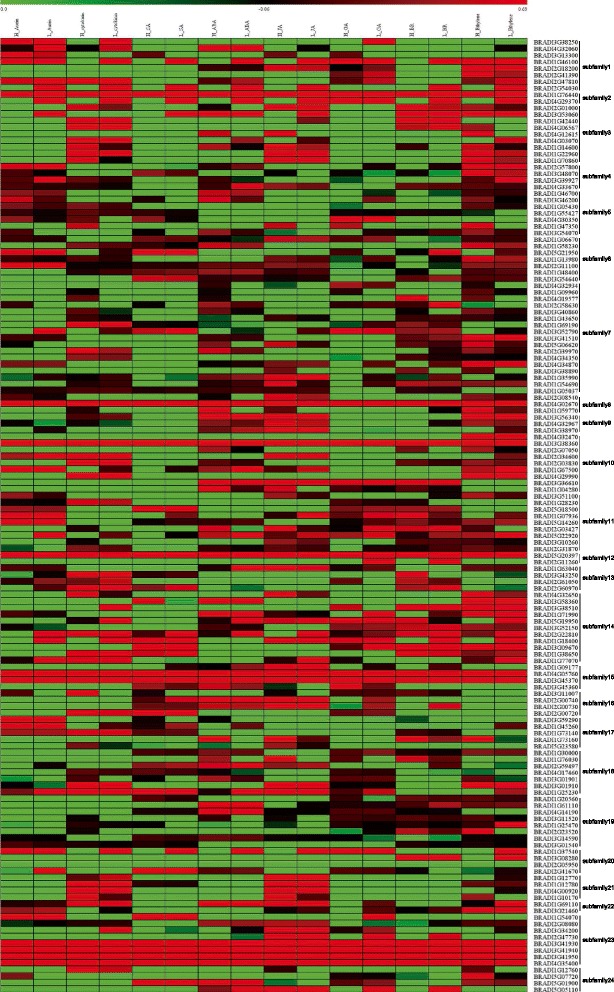
The expression profiles of BdbHLHs treated with high and low concentration of various phytohormones. The heatmap was generated with log2 based values. The color scale is shown at the top. Higher expression levels are shown in red while lower expression levels are shown in green. H stands for high concentration of phytohormone treatment while L stands for low concentration treatment