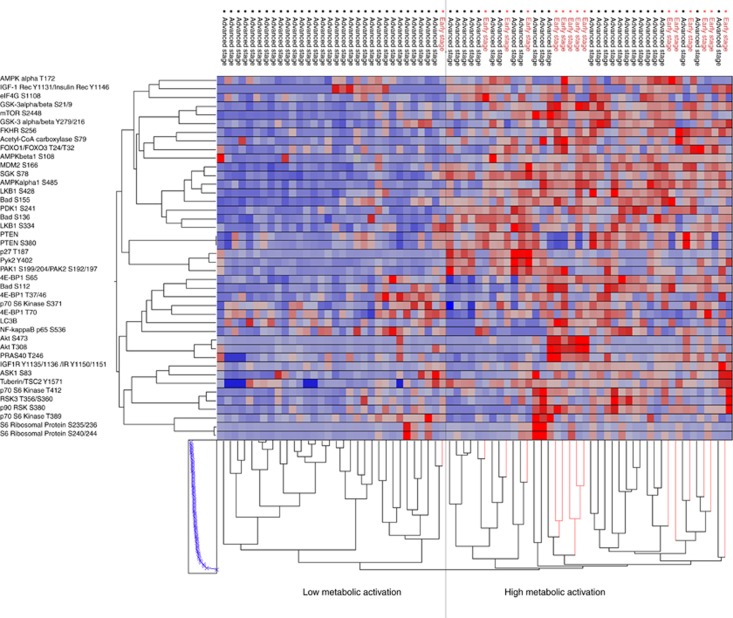
Figure 1.
Unsupervised hierarchical clustering analysis of the 42 proteins (y axis) involved in the energy cellular homeostasis with focus on the LKB1–AMPK and the AKT–mTOR signalling pathways and downstream substrates. The 72 samples included in the discovery set (x axis) were classified as early (red)- and advanced (black)-stage tumours. The two major clusters (high vs low metabolic activation) were identified by the analysis.

