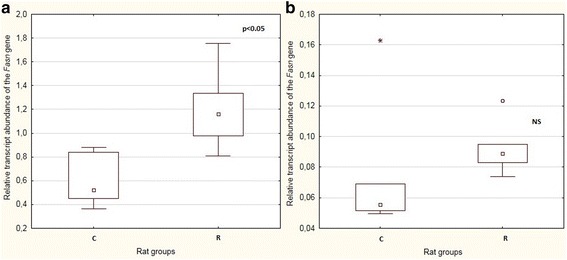
Fig. 3.

Boxplots showing median values and interquartile ranges of mRNA levels of hepatic Fasn in F0 a and F1 generation b. The circles represent outliers which extend more than 1.5 box-lengths from the edge of the box, and stars represent extreme outliers that extend more than three box-lengths; p: level of significance; NS: not significant
