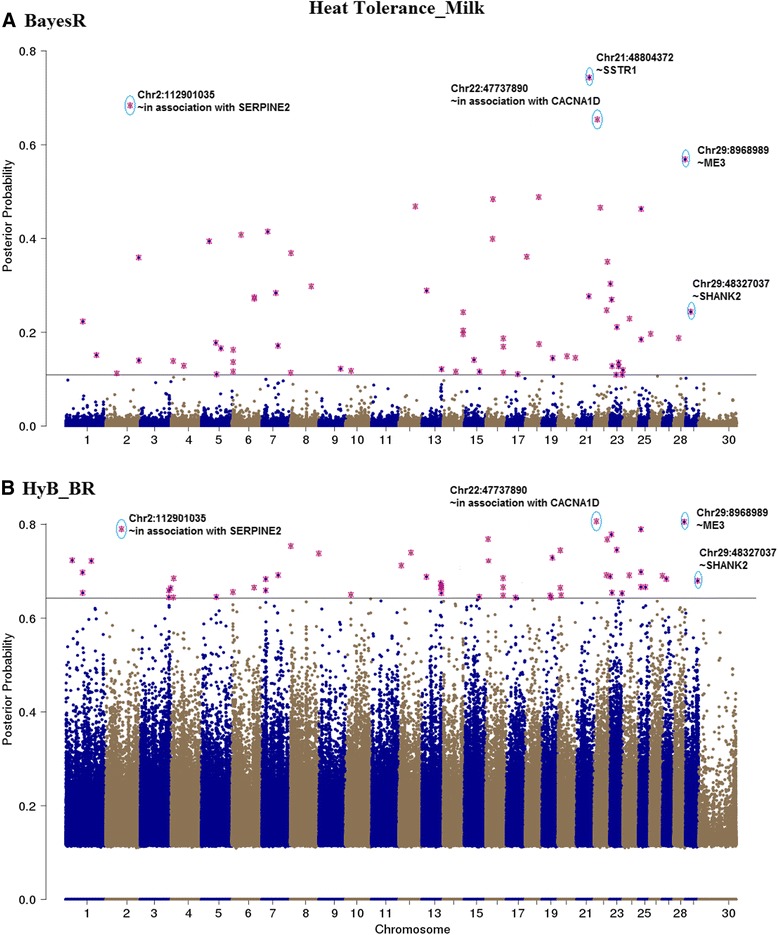
Fig. 10.

Mapping the posterior probabilities of all the variants estimated from BayesR (a) and HyB_BR (b) according to their positions (base pairs) across the whole chromosome related to Milk yield affected by heat tolerance. The top SNPs with highest posterior possibilities are labelled with blue circle
