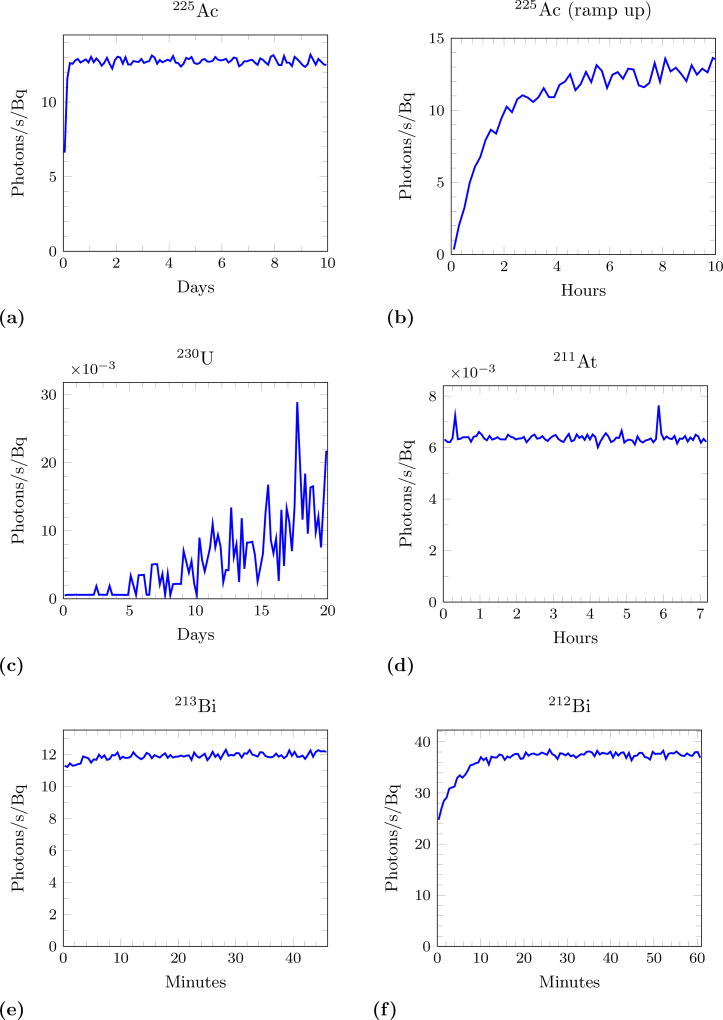
Figure 4.
Cerenkov photon production rate (normalized to activity) as a function of time from a pure sample. (a) and (b) shows two different time periods for 225Ac. Note the x-axis varies in scale to account for the different half-lives of the isotopes and that the y-axis of (c) and (d) has a factor of 10−3.

