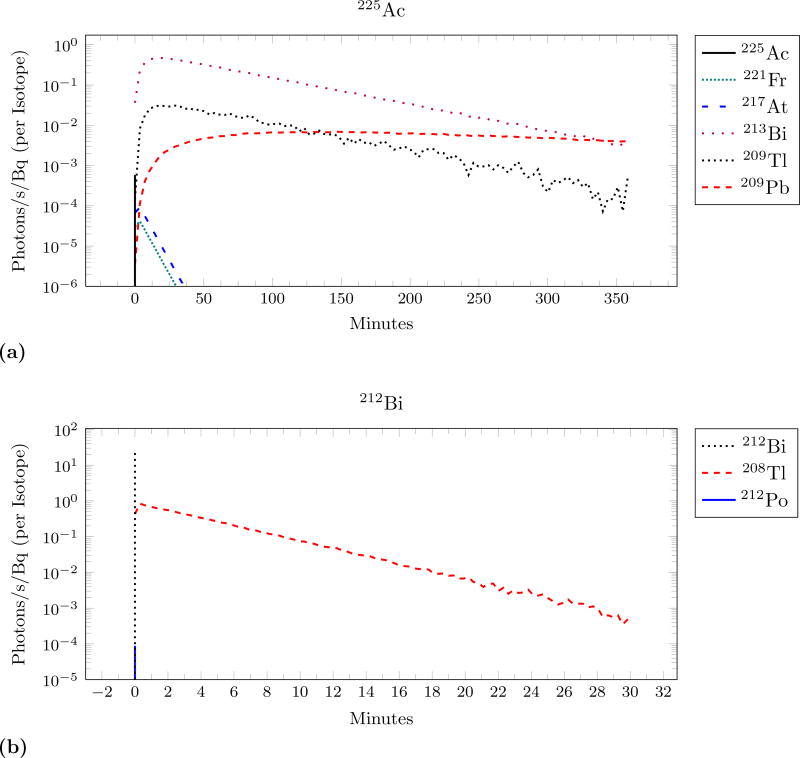
Figure 6.
The different isotopes in the decay chain are responsible for different portions of the time separation. This shows the sources of the distributions from figure 5 parts (a) and (c) on logarithmic y-axis. Vertical lines represent the delta-functions of prompt light occuring at t=0.

