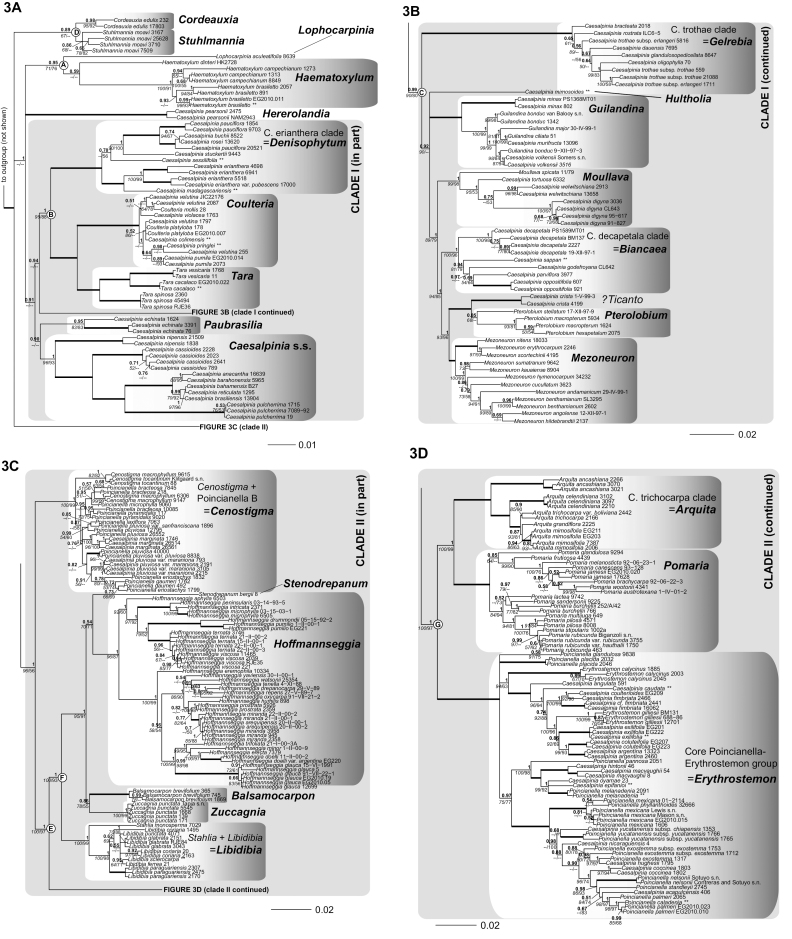
Figure 3.
A–D Phylogeny of the Caesalpinia group. Bayesian phylogram based on 312 accessions, including only accessions with two or more loci. Branch support values are indicated as follows: branches in bold indicate that maximum support has been attained in the MP, ML and Bayesian phylogenetic analyses; otherwise, posterior probabilities are indicated above in bold, with bootstrap support from ML analyses (italicised) and parsimony analyses separated by a slash below the branches; for each terminal, the species name is followed by the collector number of the corresponding voucher (see Appendix 1 for full voucher details); the suffix ** indicates that several sequences from different accessions of the same species were concatenated for analysis (see Appendix 1 for details); for major clades and genera, the names used by Gagnon et al. (2013) are indicated, as well as the corresponding new genera.

