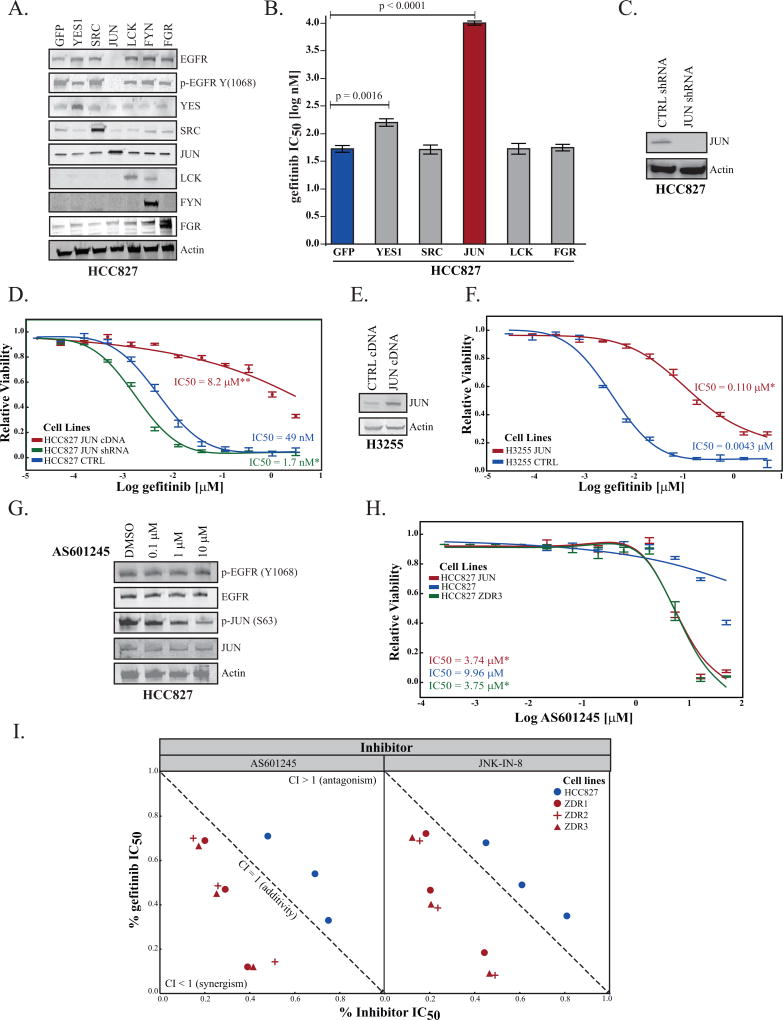
Figure 2. Expression of JUN is inversely correlated with sensitivity to gefitinib.
(A) HCC827 cells were transduced (MOI=5) with viral particles carrying (GFP) or cDNA for expression of YES1, SRC, JUN, LCK, FYN, or FGR. The levels of each transgene and EGFR were assessed by immunoblot. One representative experiment of three is shown. (B) Cell viability assays were used to determine the differential impact of overexpression of indicated genes on sensitivity to gefitinib. The IC50 values were calculated using a 4-parameter fit using that statistical package from JMP12 Pro. Each experiment was conducted at three separate time points with at least four technical replicates. Plotted are mean IC50 values ± one standard deviation from three independent experiments. Probability associated with the Student’s t-test is indicated when values are significant (p <0.05). (C) HCC827 cells were transduced with lentiviral particles for expression of control shRNA (targeting GFP) or shRNA targeting JUN. Levels of JUN were determined by immunoblot. (D) The IC50 curve fit associated with the viability of HCC827 cells stably expressing GFP (blue), JUN (red), and JUN shRNA (green) as above. Statistical significance was assessed using the IC50 value from each replicate experiment. (E) H3255 cells stably transfected for expression of control protein (GFP) or JUN were lysed and the degree of overexpression was determined by immunoblot. (F) The IC50 curve fit associated with the viability of H3255 cells expressing GFP (blue) or JUN (red) as above. (G) HCC827 cells were treated with AS601245 for 16 hours at the indicated concentrations. The cell lysate was analyzed by SDS-PAGE and immunoblot. (H) Inhibition of EGFR and JNK/JUN pathway is synergistic only in the resistant cell lines. Cell viability assays were performed with both gefitinib and two JNK inhibitors (AS601245 & JNK-IN-08) in order to determine the synergistic, additive, or antagonistic effect of simultaneous dosing in the parental or ZDR cell lines. The resulting isobologram (48) was created by determining the IC20, IC50, IC80 of each drug alone and in combination. The mean (ICxx values) of three experiments were calculated and an isobologram was drawn by JMP Pro12. The corresponding Combination Index (CI) values were calculated following the classic isobologram equation (48). Statistical significance was determined by using the Student’s t-test (p value < 0.01 for all of the points). As CI values of <1 express synergism, gefitinib + JNK inhibitors represents an example of a strongly synergistic combination in the resistant cell lines. The CI values for the parental cell line indicate a tendency toward antagonism (Student’s t-test p value < 0.05). (I) The IC50 curve fit associated with the viability of HCC827-ZDR3 cells (green) and HCC827-ZDR3 cells that stably express GFP (blue) or JUN (red), treated with AS601245 for 48 hours.

