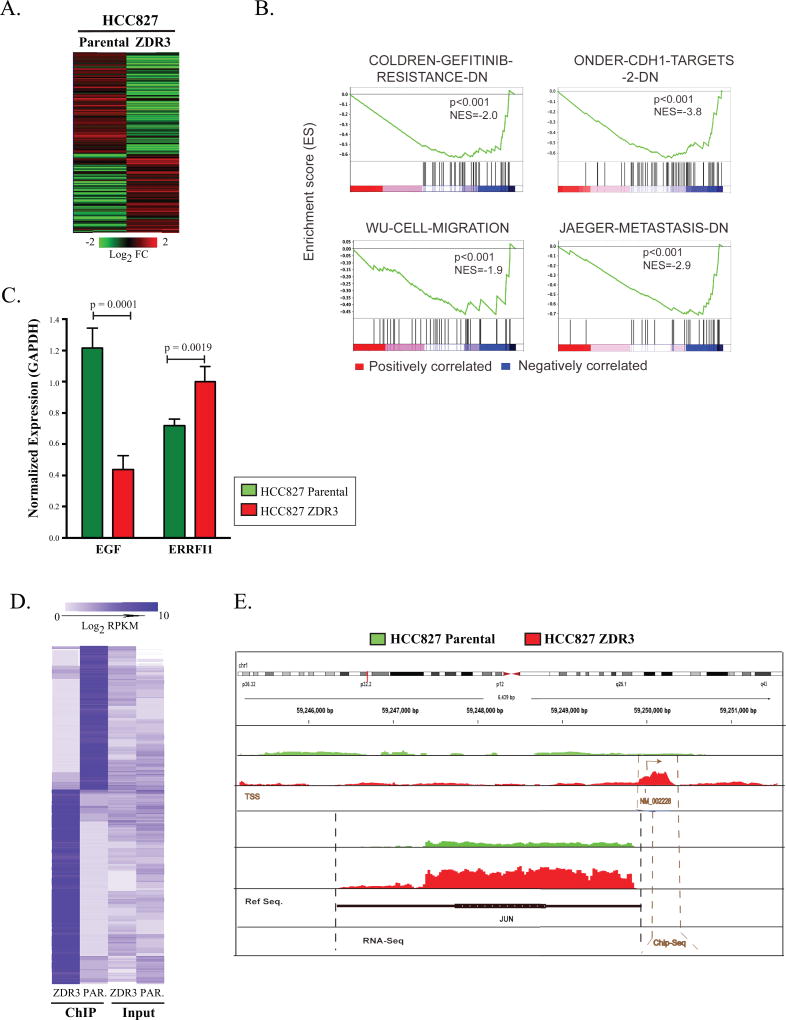
Figure 5. JUN expression promotes downregulation of EGFR activity via altered chromatin occupancy.
(A) Heatmap of differential expression of genes in HCC827 parental and ZDR3 resistant cells (260 genes with log2 fold change in expression of ± 2.0; p <0.05). (B) Gene Set Enrichment Analysis of 260 genes across various clinical datasets were ranked by a signal-to-noise metric representing their differential expression. The color of the gradient represents either positive (red) or negative (blue) correlation with the listed gene sets. (C) RT-qPCR analysis of EGF and ERBBFI1 expression in HCC827 and HCC827-ZDR cells normalized based on the expression of GAPDH. Significance was set at a p-value < 0.05. (D) The 1488 genes identified as differentially enriched in a JUN ChIP-seq experiment were subject to hierarchical clustering based on Euclidean distance and average linkage. (E) Genomic map of JUN chromosomal occupancy. Red indicates enrichment in the ZDR3 line; green indicates enrichment in the parental line.

