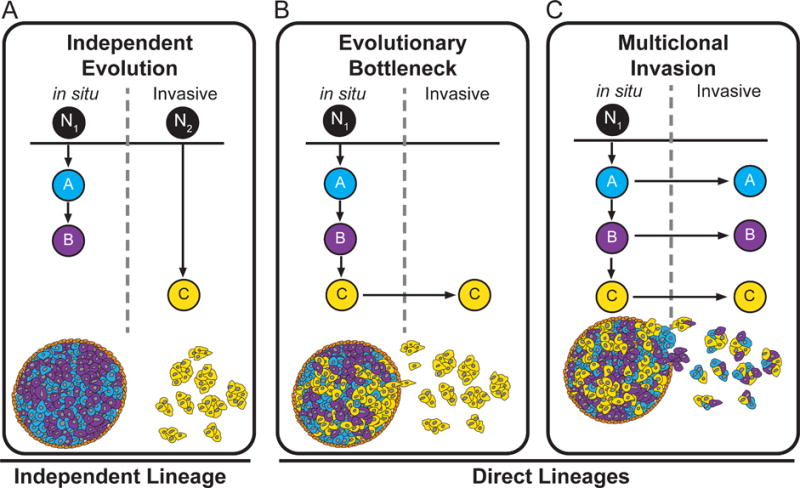
Figure 2. Evolutionary models of invasion in DCIS.

(A) Independent Evolution Model shows the in situ and invasive subpopulations evolving from independent lineages that originated from two different normal cells (N1, N2) in the breast. (B) Evolutionary Bottleneck Model shows the evolution of three clonal subpopulations from a single ancestral (N1), from which a single clone is selected during invasion and expands to form the invasive carcinoma. (C) Multiclonal Invasion Model shows the evolution of three clonal subpopulations from a single normal cell (N1), in the breast. In this model all three clones escape the duct and co-migrate into the adjacent tissues to establish the invasive carcinoma.
