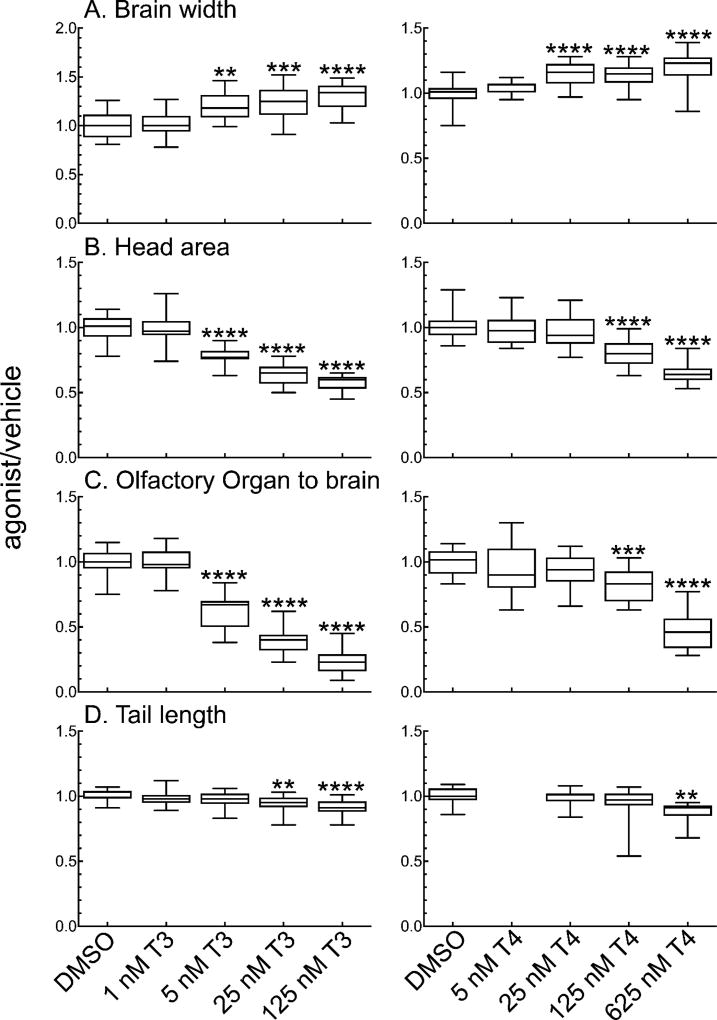
Figure 2.
T3 and T4 affect the morphology of NF-48 tadpoles in a concentration-dependent manner. A–D: Effects of varying T3 concentration are shown in the left panel; effects of varying concentrations of T4, in the right panel. A. Brain width at the widest part of the optic tectum. B. Head area. C. Distance between the olfactory organ and the brain. D. Tail length. Boxes represent the 25th–75th percentile values, and the line is at the median; whiskers show maximum and minimum values (n = 15). Significantly different from vehicle control at **, p < 0.01; ***, p<0.001; ****, p<0.0001 as determined by 1-way ANOVA with Dunnett’s multiple comparison test (MCT).

