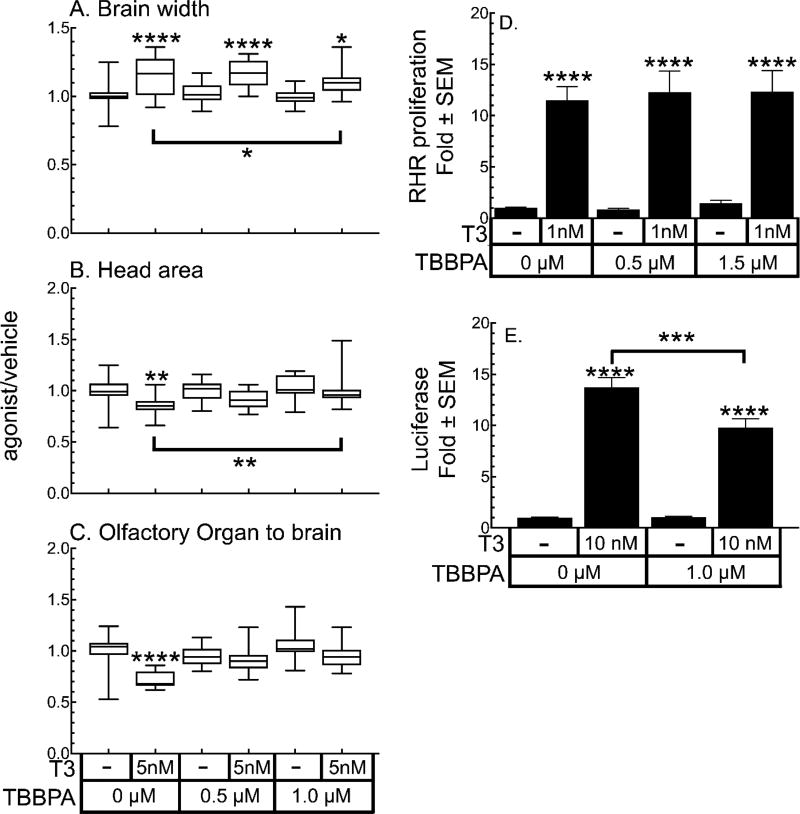
Figure 7.
TBBPA inhibits selected TH-dependent endpoints. A–C. Morphological changes induced by 5 nM T3 are inhibited by TBBPA co-treatment. Boxes represent the 25th–75th percentile values, and the line is at the median; whiskers show maximum and minimum values (n = 15). D. TBBPA does not inhibit cellular proliferation in the RHR induced by 1 nM T3. E. Inhibition of T3-induced activation of the TREluc reporter in tadpole heads by TBBPA. Bars represent the mean with standard error (n = 15). Significantly different from vehicle control at *, p < 0.05; **, p < 0.01; ***, p<0.001; ****, p<0.0001 as determined by 1-way ANOVA with Sidak’s multiple comparison test (MCT).

