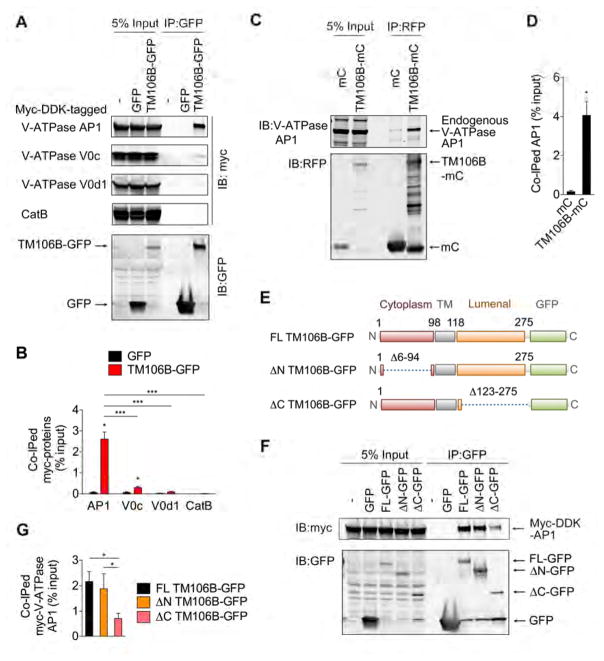
Figure 6. TMEM106B interacts with V-ATPase AP1.
(A) Representative blots of co-IP experiments using HEK293T cells expressing GFP or TMEM106B-GFP (TM106B-GFP), together with Myc-DDK-tagged V-ATPase AP1, V0c, and V0d1 and CatB.
(B) Quantification of co-IP in (A). Mean ± sem, n = 3, *p < 0.05; Unpaired T-test (compared with GFP), ***p < 0.01; One-way ANOVA with Tukey’s post hoc test (between TM106B-GFP IPs).
(C) Representative blots using of co-IP experiments using HEK293T cells expressing mCherry (mC) or TMEM106B-mCherry (TM106B-mC).
(D) Quantification of co-IP in (C). Mean ± sem, n = 4, *p < 0.05; Unpaired T-test.
(E) Schematic drawing of full-length (FL) TM106B-GFP and TM106B-GFP lacking aa6–94 (ΔN) and aa123–275 (ΔC).
(F) Representative blots of co-IP experiments using HEK293T cells expressing GFP, FL TMEM106B-GFP,ΔN TMEM106B-GFP, or ΔC TMEM106B-GFP, together with Myc-DDK-tagged V-ATPase AP1.
(G) Quantification of co-IP in (F). Mean ± sem, n = 3, *p < 0.05; One-way ANOVA with Tukey’s post hoc test.

