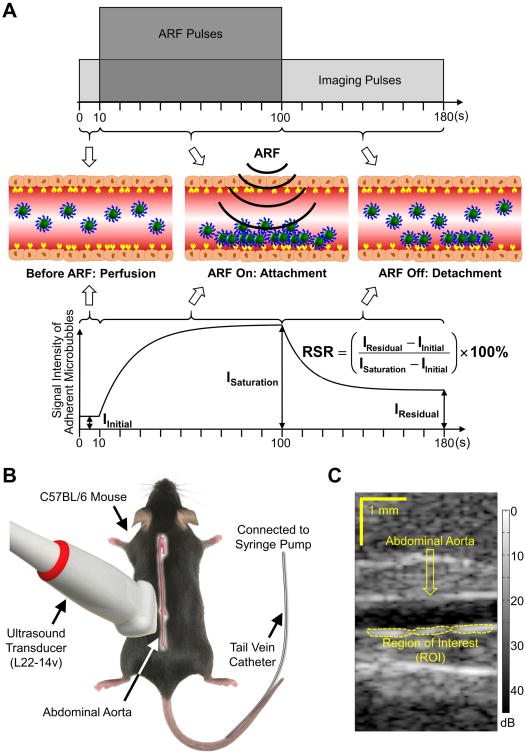
Figure 1. The modulated ARF-based imaging.
A, Schematic diagram illustrating the imaging sequence (top), microbubble dynamic behaviors (middle), and the signal intensity curve of adherent microbubbles and RSR (bottom). B, Mouse was placed in the prone position with the ultrasound transducer imaging the abdominal aorta. Microbubble infusion was administered via a tail vein catheter connected to a syringe pump. C, A sample B-mode image of the mouse abdominal aorta.

