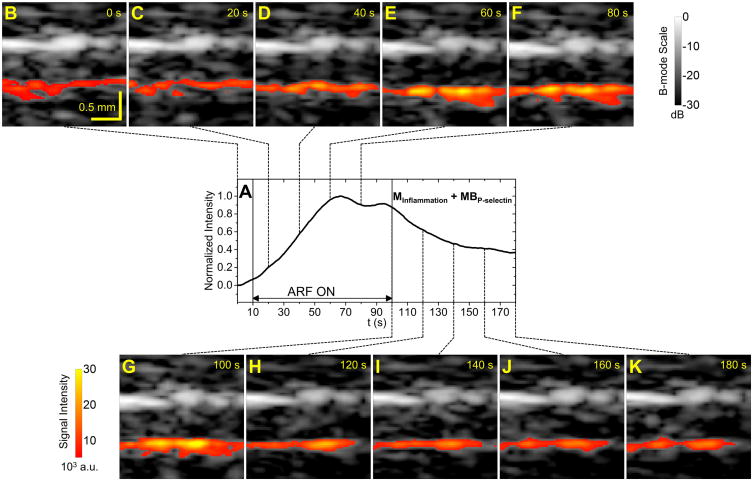
Figure 3. Example signal intensity curve and corresponding ultrasound images for targeted group.
A, Signal intensity curve for one trial from the group of MInflammation + MBP-selectin. ARF was applied from 10 s to 100 s. B to K, Corresponding B-mode images overlaid with color-coded microbubble signal along the bottom vessel wall at different time points.

