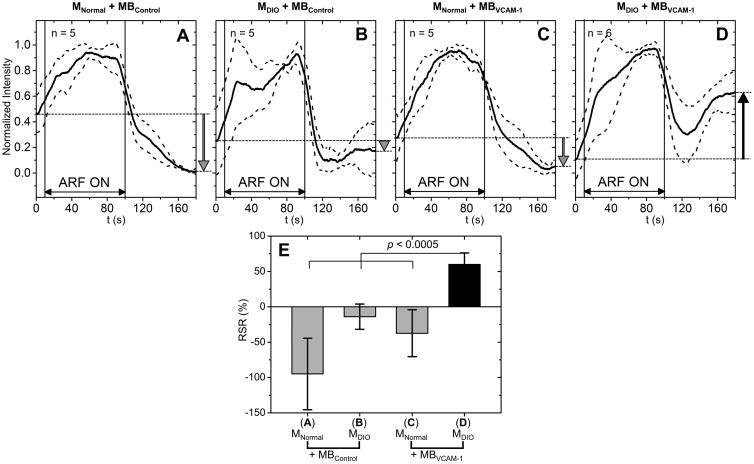
Figure 6. Signal intensity curves and RSRs for DIO model.
Signal intensity curves for the groups of: MNormal + MBControl (A), MDIO + MBControl (B), MNormal + MBVCAM-1 (C), and MDIO + MBVCAM-1 (D). Solid lines indicate the mean and dotted lines indicate the error bars (mean ± standard deviation). E, RSR for all groups. RSR for the group of MDIO + MBVCAM-1 was significantly higher than that of other groups (p < 0.0005).

