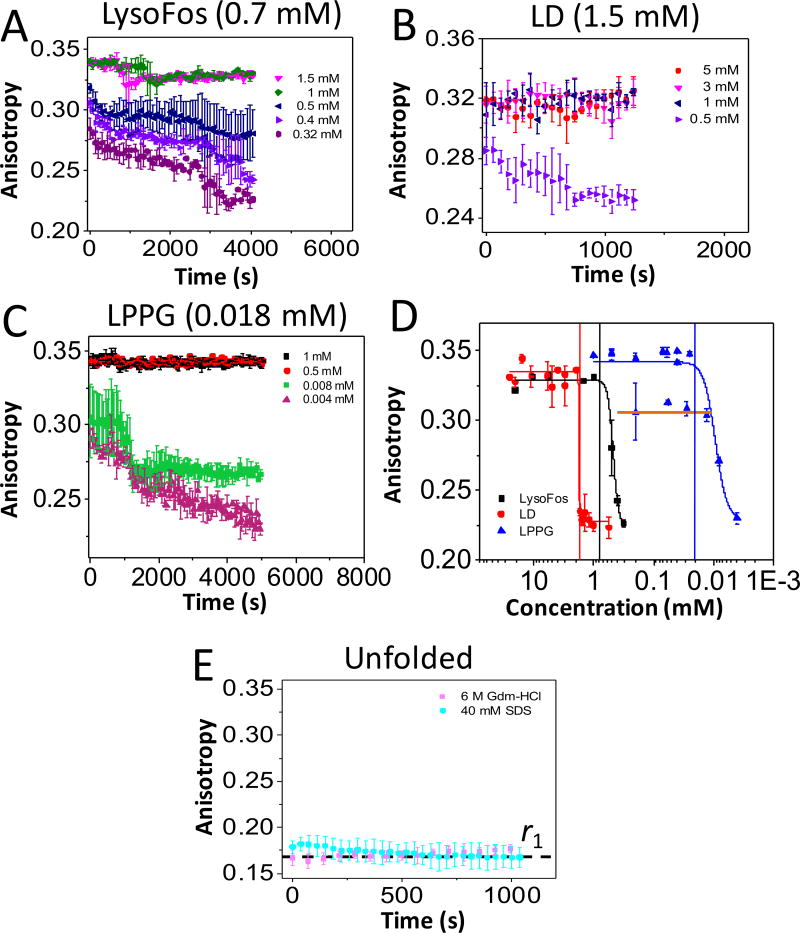
Figure 2. Time-dependent anisotropy showing the protein-detergent complex (PDC) interfacial dynamics of FhuA ΔC/Δ5L.
The anisotropy data were acquired by adding overnight refolded protein to a bath of varying detergent concentration. All anisotropy measurements were carried out at room temperature in 200 mM NaCl, 50 mM HEPES, pH 7.4. The starting detergent concentrations were as follows: (A) 20 mM LysoFos; (B) 5 and 25 mM LD; and (C) 0.2, 0.5, and 1 mM LPPG. In (D), it is shown concentration-response anisotropy changes as a result of the PDC dissociation. The horizontal axis indicates individual dilutions of detergent concentrations, while keeping the final protein concentration constant at 28 nM (see Experimental Section). The anisotropy values on the vertical axis were collected 24 hours later for equilibrium determinations. The LPPG data points belonging to the maximum state (rmax = ~0.342) were obtained when the protein was refolded in either 0.5 or 1 mM LPPG. The orange horizontal line on the LPPG data points corresponds to a secondary maximum anisotropy value, rmax = 0.31, when the protein was refolded in 200 µM LPPG; (E) This panel shows a low anisotropy value, r1, which was recorded either in the presence of 40 mM SDS or 6 M Gdm-HCl. The top of each panel or vertical bars indicate the CMC (Table S1).

