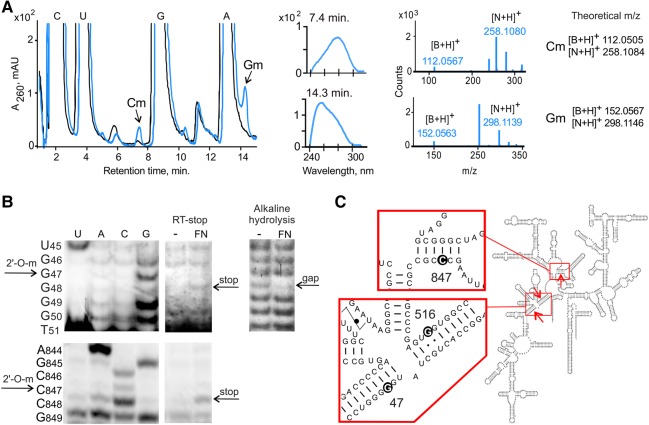
FIGURE 2.
Identification of methylation products by HPLC/MS and reverse transcription analysis. (A) HPLC/MS analysis of P1 nuclease-digested 16S rRNA substrate after incubation with aFib–Nop5 (blue) and control in the absence of aFib–Nop5 (black). UV chromatograms are shown together with UV absorption and mass spectra (Hall 1971) of the indicated peaks. N denotes nucleoside; B denotes nucleobase. (B) Sequence mapping of aFib–Nop5 modified sites. (Upper panels) analysis of modified 16S.5′ (subfragment 1–93) using an RT-stop assay (left) and alkaline hydrolysis with a subsequent primer extension (right). (Lower panel) analysis of modified 16S rRNA using an RT-stop assay. 2′-O-modified nucleotides correspond to enhanced bands (RT-stop) or gaps (alkaline hydrolysis) in the sequencing ladders. (C) Schematic depiction of aFib–Nop5 target sites G47, G516, and C847 in P. abyssi 16S rRNA.

