FIGURE 1.
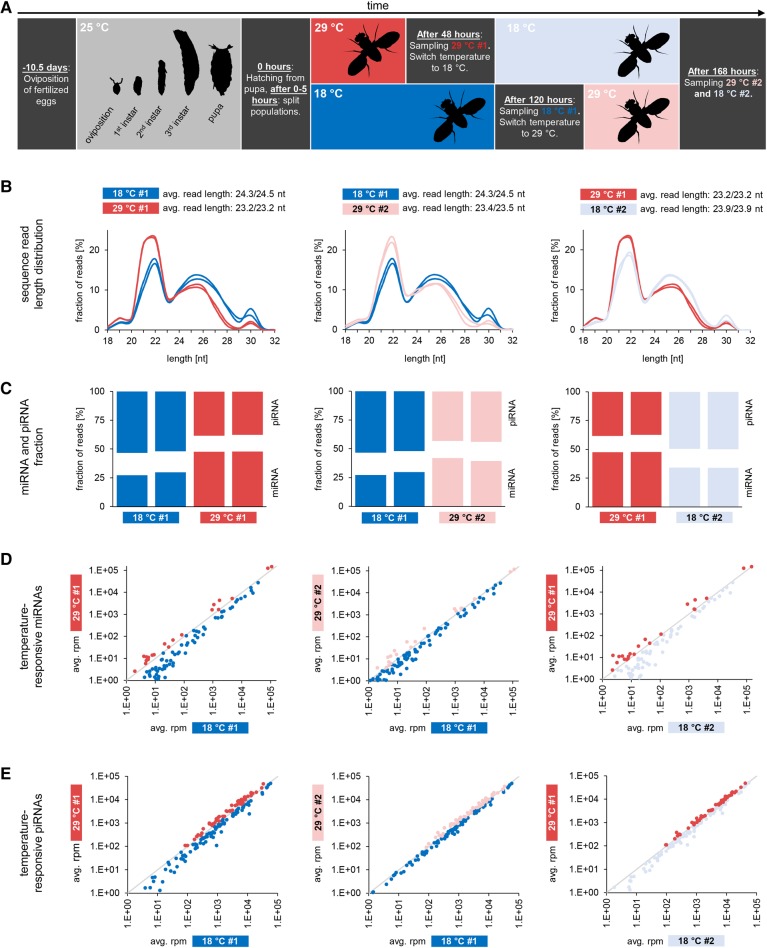
Sequence length distribution and composition of small RNA transcriptomes from ovaries of flies kept at different temperatures. (A) Experimental setup. Colors used in this figure are used to denote different probes in all following figures (Figs. 2–4). (B) Comparison of sequence length distribution. Left plot compares sequence length distribution of probes obtained from two different fly populations, one kept at 18°C after hatching (blue, two replicates), the other kept at 29°C after hatching (red, two replicates). The middle plot compares sequence length distribution of probes obtained from one population, initially kept at 18°C (blue, two replicates) and then at 29°C (light red, two replicates). The right plot compares sequence length distribution of probes obtained from another population, initially kept at 29°C (red, two replicates) and then at 18°C (light blue, two replicates). (C) Abundance of miRNAs and piRNAs. Comparisons are as described above with two replicates per probe shown. miRNAs are more abundant under 29°C conditions whereas piRNAs are more abundant under 18°C conditions. (D) Temperature-responsive miRNAs. Comparisons are as described above. Dots in red (dark and light), as well as dots in blue (dark and light), refer to identical miRNAs across different probes in all three plots. (E) Temperature-responsive piRNAs, grouped according to the transposons from which they derive. Comparisons are as described above. Dots in red (dark and light), as well as dots in blue (dark and light), refer to identical miRNAs across different probes in all three plots.

